Plot Tradeoff
Usage
plotTradeoff(
  slick,
  xPI = NULL,
  yPI = NULL,
  OMs = NA,
  MP_label = "Code",
  lab_size = 6,
  point_size = 2,
  size.axis.title = 14,
  size.axis.text = 12
)
Arguments
- slick
A
Slick-class()object- xPI
Numeric value indicating the PI to plot on the x-axis. Multiple values are accepted. Recycled if
xPI<yPI- yPI
Numeric value indicating the PI to plot on the y-axis. Multiple values are accepted. Recycled if
yPI<xPI- OMs
Integers representing the OMs to include in the plot. Defaults to all.
- MP_label
Label to use for the MPs. Either
CodeorLabel.Descriptionworks as well, but you probably don't want to do that.- lab_size
Size of the MP labels
- point_size
Size of the points
- size.axis.title
Size of axis title
- size.axis.text
Size of axis text
Examples
# Generate dummy values
nOM <- 2
nMP <- 4
nPI <- 4

values <- array(NA, dim=c(nOM, nMP, nPI))

pi_means <- runif(nPI, 5, 50)
for (om in 1:nOM) {
  for (mp in 1:nMP) {
    for (pi in 1:nPI) {
      values[om, mp, pi] <- rlnorm(1,log(pi_means[pi]), 0.4)
    }
  }
}

# Create and populate Object
tradeoff <- Tradeoff(Code=c('PI1', 'PI2', 'PI3', 'PI4'),
               Label=c('Performance Indicator 1',
                       'Performance Indicator 2',
                       'Performance Indicator 3',
                       'Performance Indicator 4'),
               Description = c('This is the description for PI 1',
                               'This is the description for PI 2',
                               'This is the description for PI 3',
                               'This is the description for PI 4'),
               Value=values)

# Check
Check(tradeoff)
#>
#> ── Checking: "Tradeoff" ──
#>
#> ✔ Complete

# Add to `Slick` object
slick <- Slick()
Tradeoff(slick) <- tradeoff

# Plots
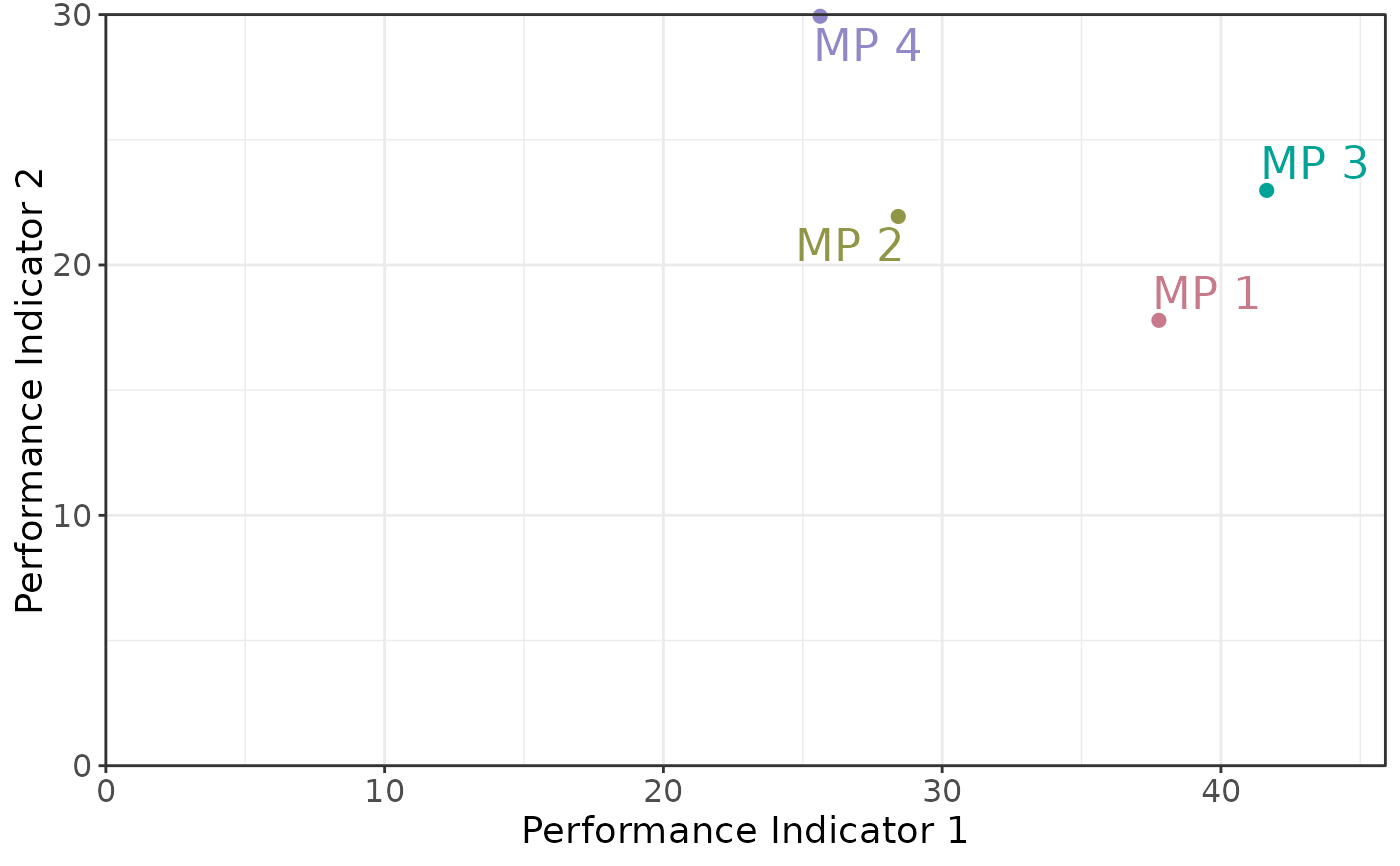
plotTradeoff(slick)
#> ℹ Note: `MPs` is empty. Using default MP names and colors


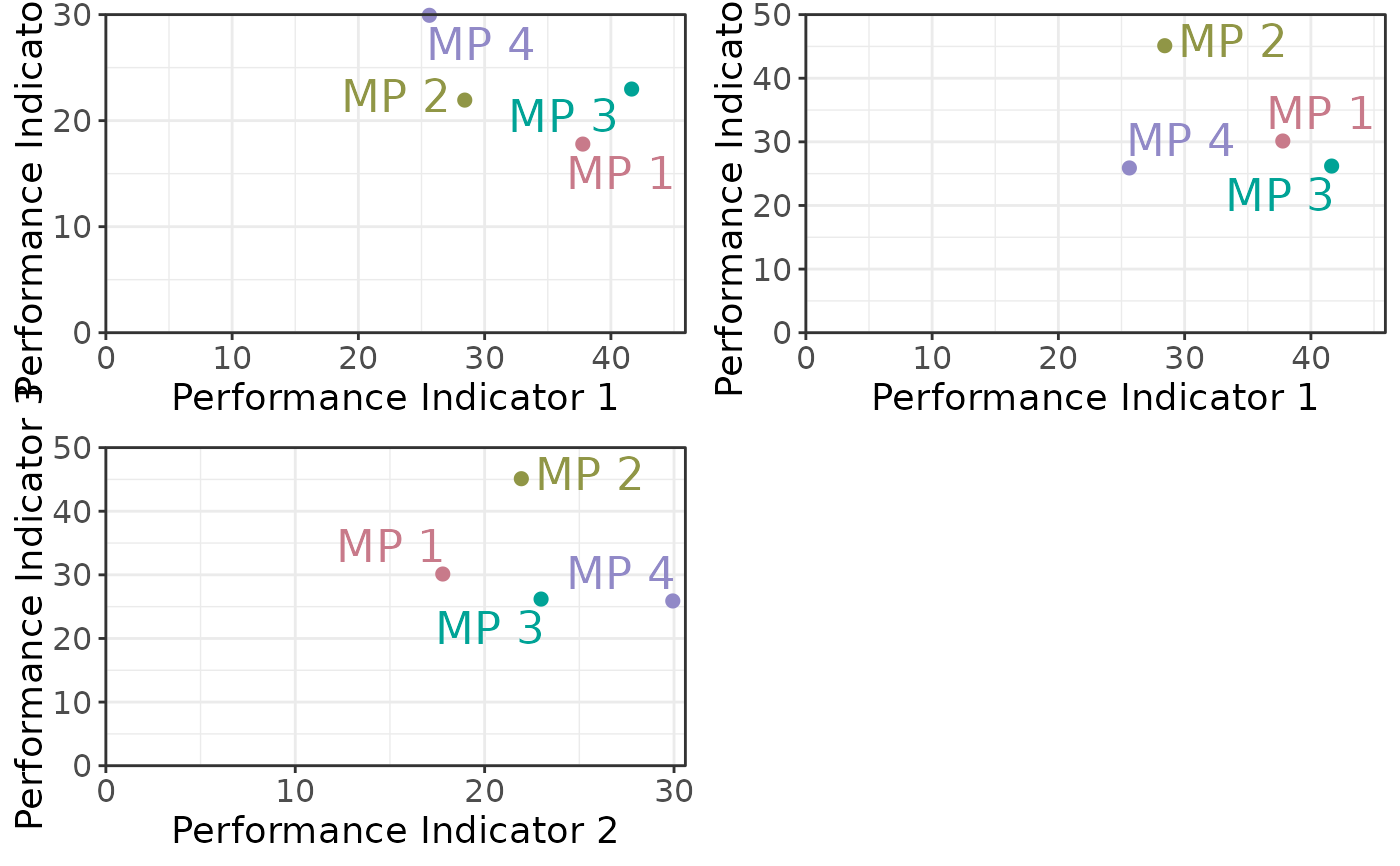
plotTradeoff(slick, c(1,1,2), c(2,3,3))
#> ℹ Note: `MPs` is empty. Using default MP names and colors
