Objects of class Boxplot are used to store information for the Boxplot and Violin plots.
Like all S4 objects in Slick, slots in this object can be accessed and
assigned using functions corresponding to slot name. See Boxplot() and the
the See Also section below.
Details
Objects of class Boxplot are created with Boxplot()
Slots
CodeA short code for the Performance Indicators for this object. A character string length
nPIor a named list for multi-language support. SeeDetailsLabelA short label for the Performance Indicators for this object. Used to label axes on charts. Can be longer than
Codebut recommended to keep short as possible so it shows clearly in plots and tables. A character string lengthnPIor a named list for multi-language support. SeeDetailsDescriptionA description for the Performance Indicators for this object. Can include Markdown, see
Examples. A character string lengthnPIor a named list for multi-language support. SeeDetailsValueA numeric array with the stochastic performance indicator values for each simulation (sim), operating model (OM), management procedure (MP), and performance indicator (PI). Dimensions: c(
nsim,nOM,nMP, andnPI).PresetAn optional named list for the preset buttons in the
App(). The name of the list element will appear as a button in theApp().DefaultsA list object with default selections for the Boxplot. See
Boxplot()MiscA named list for additional miscellaneous information.
Examples
# Generate dummy values
nsim <- 10
nOM <- 2
nMP <- 4
nPI <- 3
values <- array(NA, dim=c(nsim, nOM, nMP, nPI))
pi_means <- runif(nPI, 5, 50)
for (om in 1:nOM) {
for (mp in 1:nMP) {
for (pi in 1:nPI) {
values[,om, mp, pi] <- rlnorm(nsim, log(pi_means[pi]), 0.4)
}
}
}
# Create and populate Object
boxplot <- Boxplot(Code=c('PI1', 'PI2', 'PI3'),
Label=c('Performance Indicator 1',
'Performance Indicator 2',
'Performance Indicator 3'),
Description = c('This is the description for PI 1',
'This is the description for PI 2',
'This is the description for PI 3'),
Value=values)
# Check
Check(boxplot)
#>
#> ── Checking: "Boxplot" ──
#>
#> ✔ Complete
# Add to `Slick` object
slick <- Slick()
Boxplot(slick) <- boxplot
# Plots
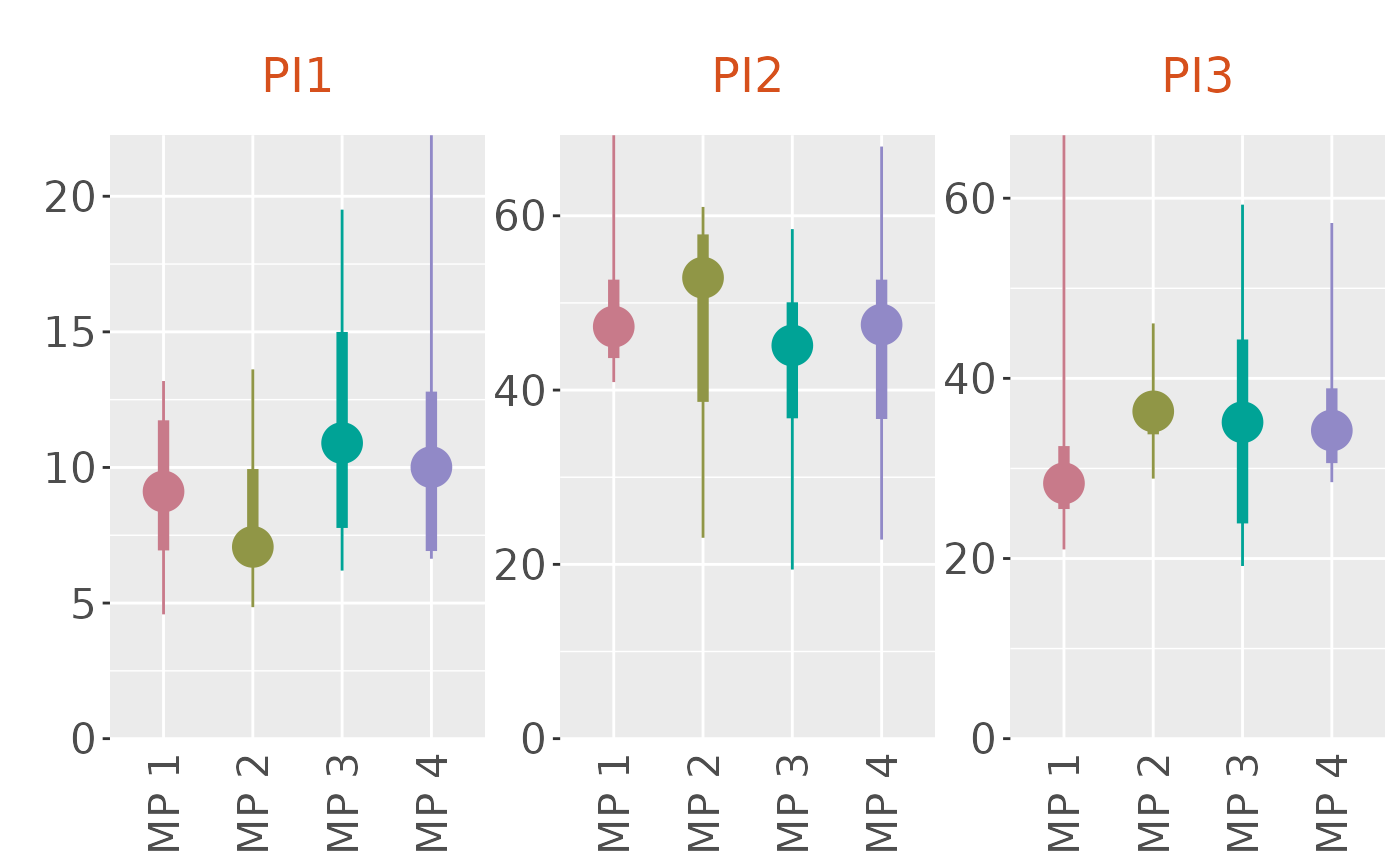
plotBoxplot(slick)
#> ℹ Note: `MPs` is empty. Using default MP names and colors
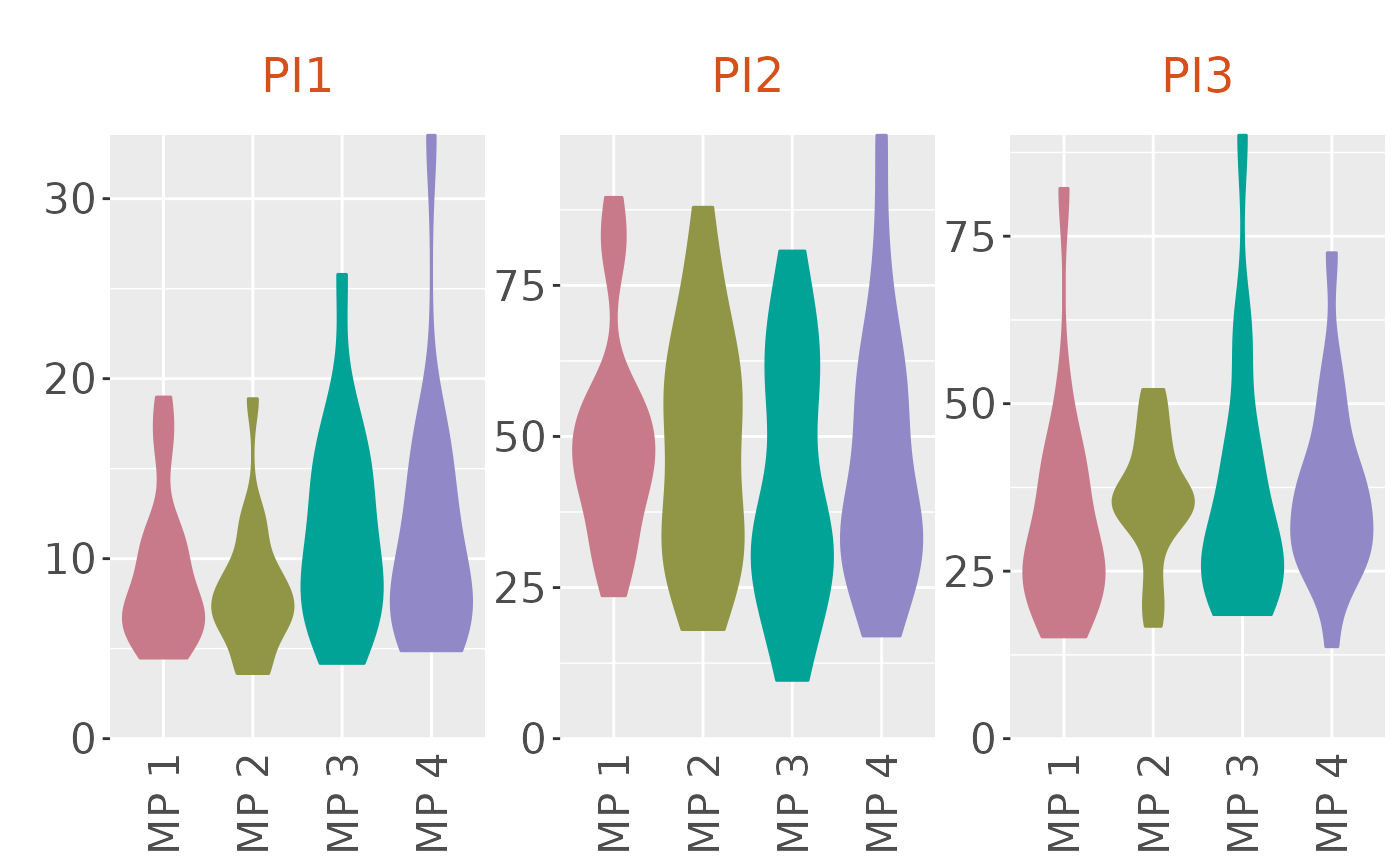
 plotBoxplot(slick, type='violin')
#> ℹ Note: `MPs` is empty. Using default MP names and colors
plotBoxplot(slick, type='violin')
#> ℹ Note: `MPs` is empty. Using default MP names and colors
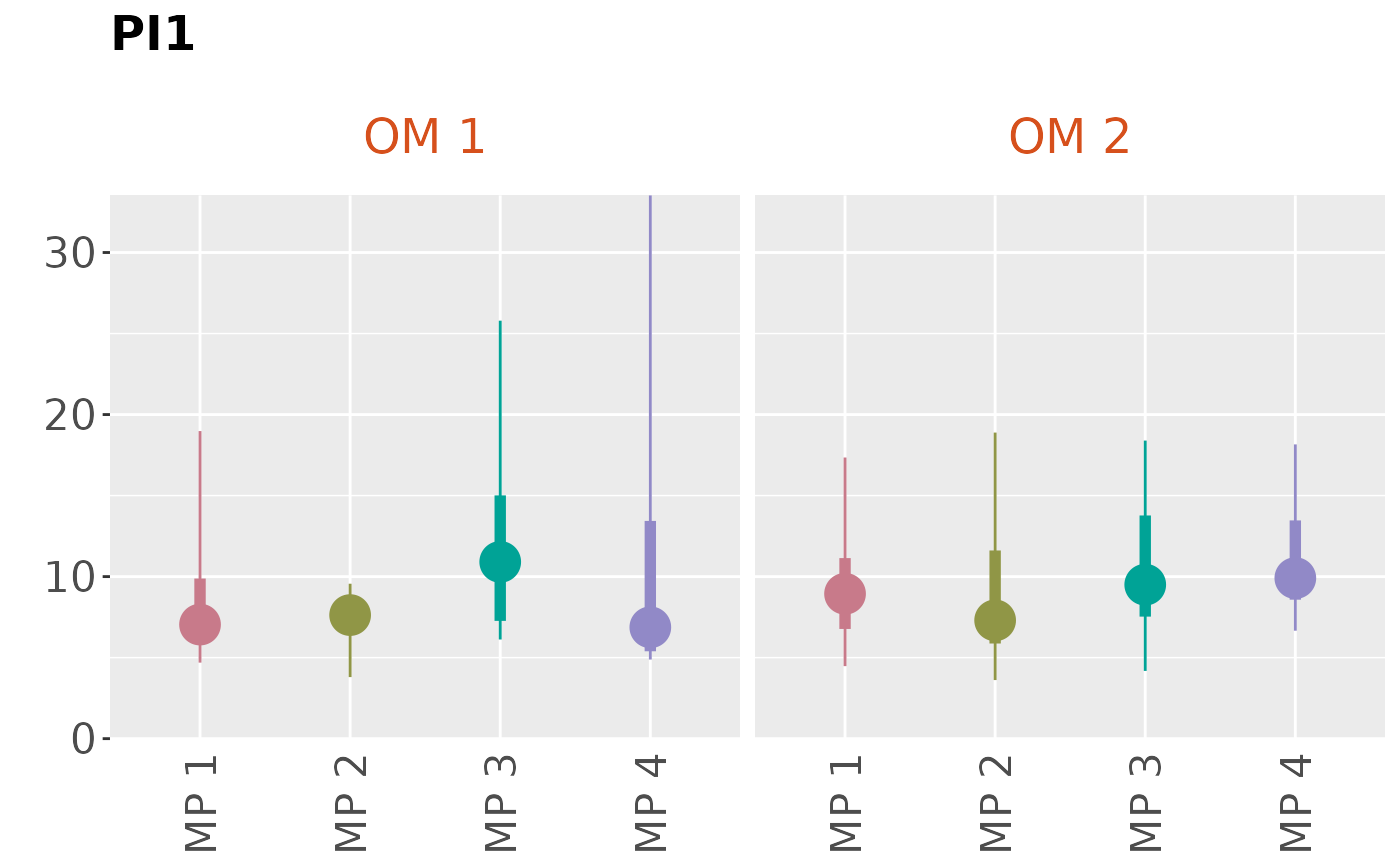
 plotBoxplot(slick, byOM=TRUE)
#> ℹ Note: `MPs` is empty. Using default MP names and colors
plotBoxplot(slick, byOM=TRUE)
#> ℹ Note: `MPs` is empty. Using default MP names and colors
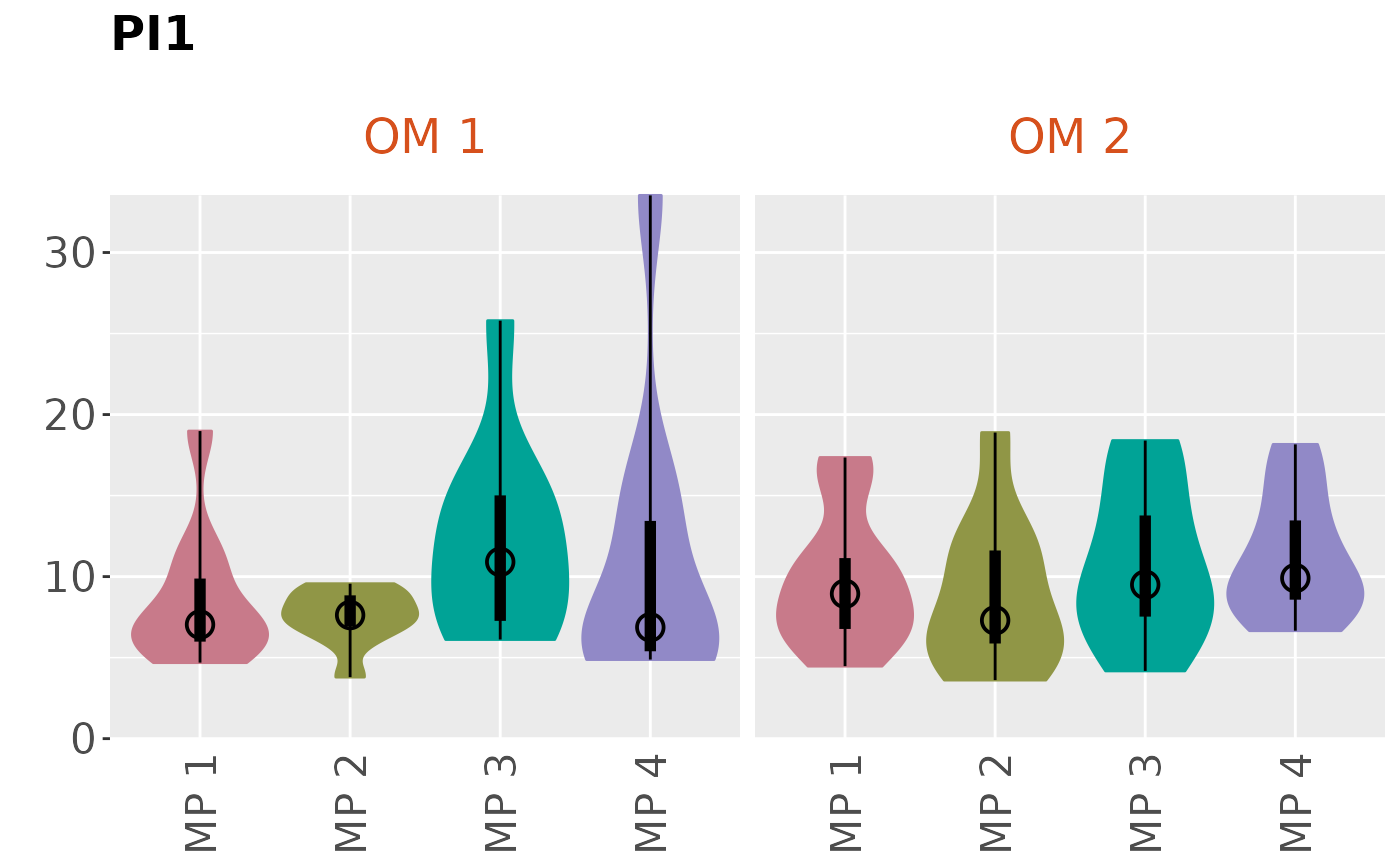
 plotBoxplot(slick, 2, type='both', byOM=TRUE)
#> ℹ Note: `MPs` is empty. Using default MP names and colors
plotBoxplot(slick, 2, type='both', byOM=TRUE)
#> ℹ Note: `MPs` is empty. Using default MP names and colors