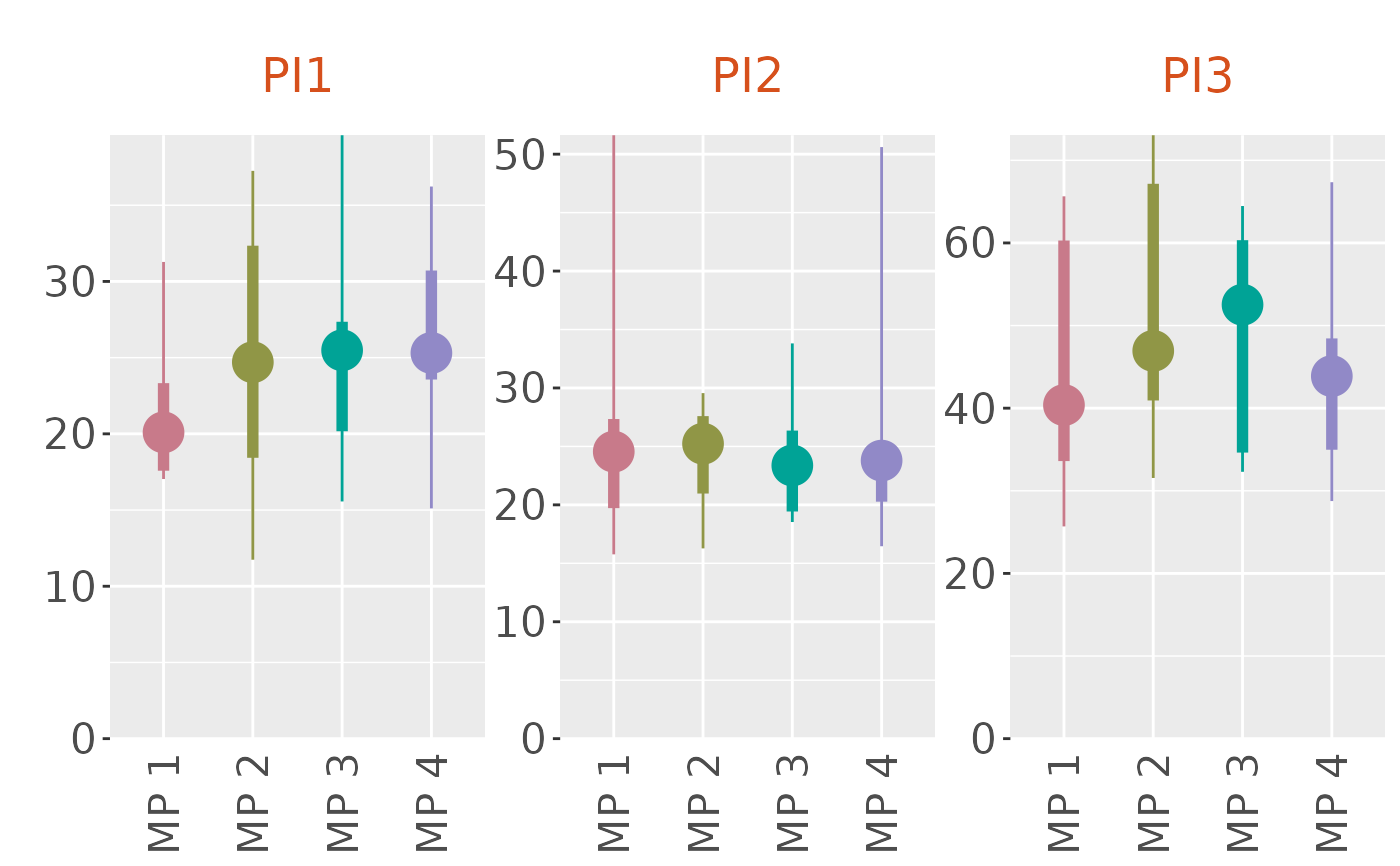
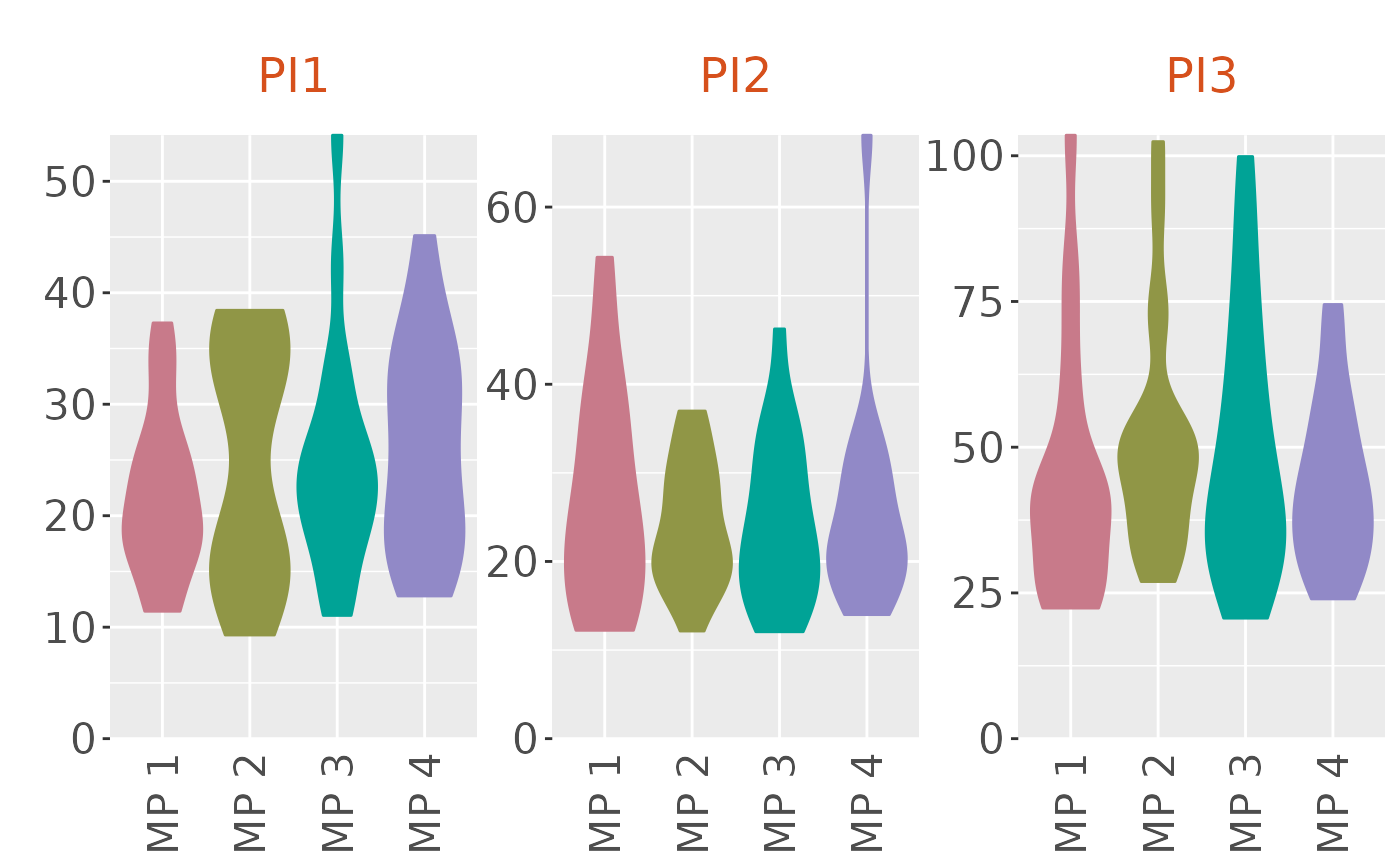
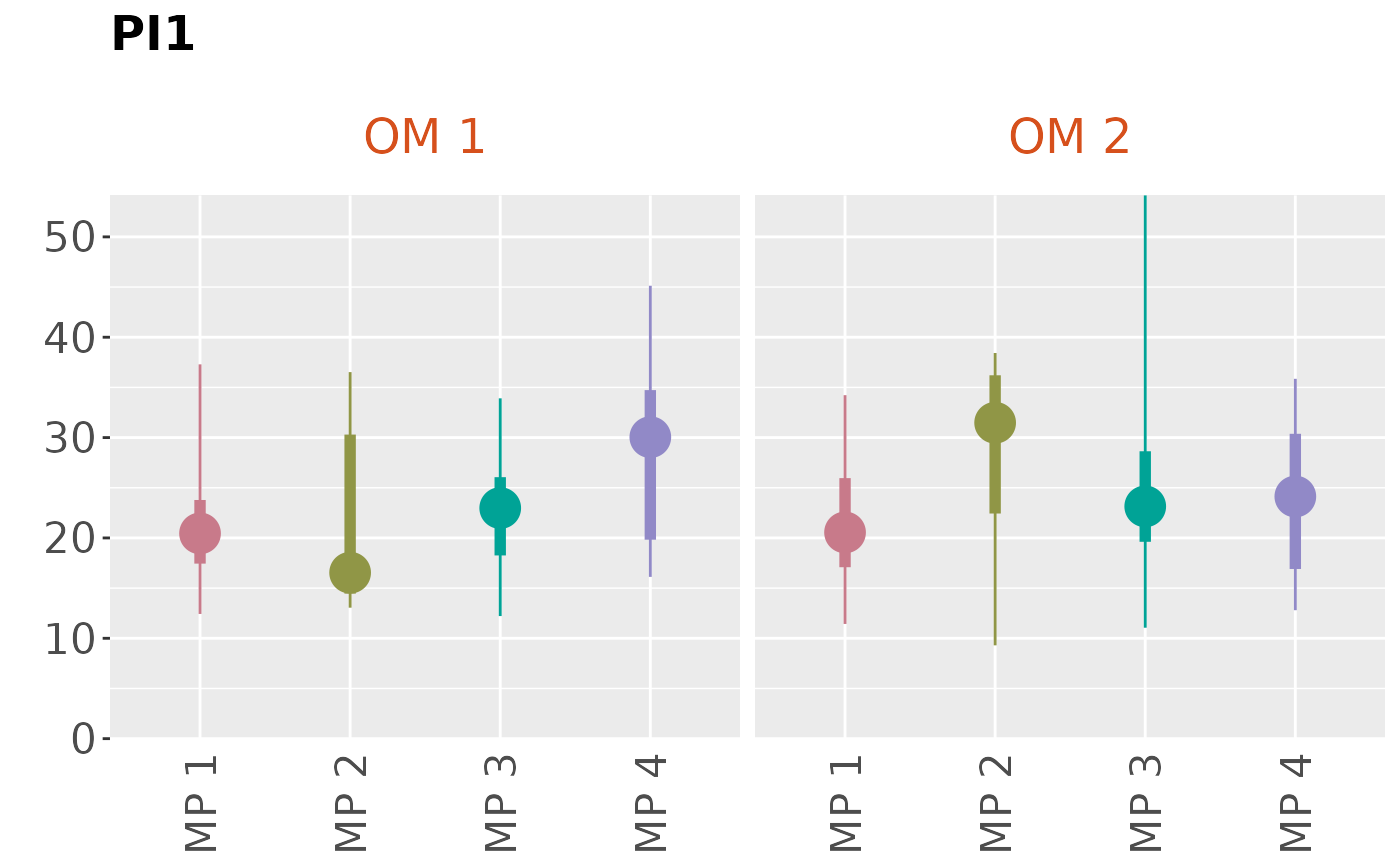
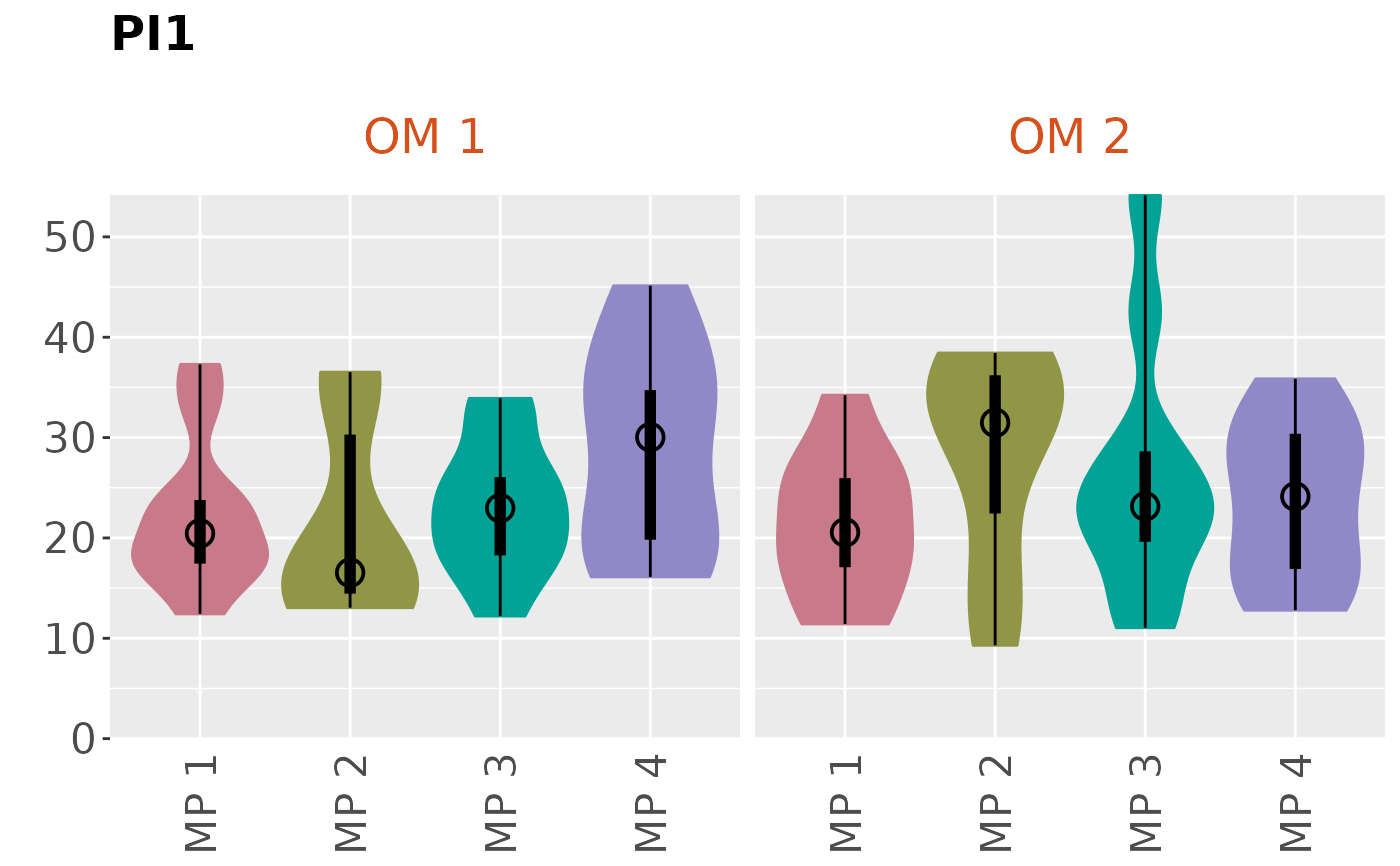
Plots boxplot, violin plot, or a combined box+violin plot for information stored in a Boxplot object
Usage
plotBoxplot(
  slick,
  PI = NULL,
  type = c("boxplot", "violin", "both", "all"),
  byOM = FALSE,
  OMs = NA,
  ncol = 4,
  MP_label = "Code",
  PI_label = "Code"
)
Arguments
- slick
A
Slick-class()object- PI
Numeric value indicating the Performance Indicator(s) to plot from the
Boxplot-classobject. If NULL, it will facet_wrap all PIs- type
Character string specifying the plot type.
- byOM
Logical. Facet the plots by operating model? PI must be a single value
- OMs
Integers representing the OMs to include in the plot. Defaults to all.
- ncol
Numeric. Number of columns
- MP_label
Label to use for the MPs. Either
CodeorLabel.Descriptionworks as well, but you probably don't want to do that.- PI_label
Label to use for the PIs. Either
CodeorLabel.Descriptionworks as well, but you probably don't want to do that.
Examples
# Generate dummy values
nsim <- 10
nOM <- 2
nMP <- 4
nPI <- 3

values <- array(NA, dim=c(nsim, nOM, nMP, nPI))
pi_means <- runif(nPI, 5, 50)
for (om in 1:nOM) {
  for (mp in 1:nMP) {
    for (pi in 1:nPI) {
      values[,om, mp, pi] <- rlnorm(nsim, log(pi_means[pi]), 0.4)
    }
  }
}

# Create and populate Object
boxplot <- Boxplot(Code=c('PI1', 'PI2', 'PI3'),
                   Label=c('Performance Indicator 1',
                           'Performance Indicator 2',
                           'Performance Indicator 3'),
                   Description = c('This is the description for PI 1',
                                   'This is the description for PI 2',
                                   'This is the description for PI 3'),
                   Value=values)

# Check
Check(boxplot)
#>
#> ── Checking: "Boxplot" ──
#>
#> ✔ Complete

# Add to `Slick` object
slick <- Slick()
Boxplot(slick) <- boxplot

# Plots
plotBoxplot(slick)
#> ℹ Note: `MPs` is empty. Using default MP names and colors


plotBoxplot(slick, type='violin')
#> ℹ Note: `MPs` is empty. Using default MP names and colors


plotBoxplot(slick, byOM=TRUE)
#> ℹ Note: `MPs` is empty. Using default MP names and colors


plotBoxplot(slick, 2, type='both', byOM=TRUE)
#> ℹ Note: `MPs` is empty. Using default MP names and colors
