Methods for Creating, Accessing and Assigning Boxplot objects
Source: R/aa_generics.R, R/class_Boxplot.R, R/class_Slick.R
Boxplot-methods.RdThe Boxplot function is used both to create and modify an Boxplot-class() object.
and to access and assign Boxplot for an object of class Slick-class().
See Details.
Usage
Boxplot(
  Code = "",
  Label = "",
  Description = "",
  Value = array(),
  Preset = list(),
  Defaults = list("overall", "boxplot"),
  Misc = list()
)

Boxplot(Slick) <- value

# S4 method for class 'missing'
Boxplot()

# S4 method for class 'character_list'
Boxplot(
  Code = "",
  Label = "",
  Description = "",
  Value = array(),
  Preset = list(),
  Defaults = list("overall", "boxplot"),
  Misc = list()
)

# S4 method for class 'Slick'
Boxplot(Code)

# S4 method for class 'Slick'
Boxplot(Slick) <- value
Arguments
- Code
A short code for the Performance Indicators for this object. A character string length
nPIor a named list for multi-language support. SeeDetails- Label
A short label for the Performance Indicators for this object. Used to label axes on charts. Can be longer than
Codebut recommended to keep short as possible so it shows clearly in plots and tables. A character string lengthnPIor a named list for multi-language support. SeeDetails- Description
A description for the Performance Indicators for this object. Can include Markdown, see
Examples. A character string lengthnPIor a named list for multi-language support. SeeDetails- Value
A numeric array with the stochastic performance indicator values for each simulation (sim), operating model (OM), management procedure (MP), and performance indicator (PI). Dimensions: c(
nsim,nOM,nMP, andnPI).- Preset
An optional named list for the preset buttons in the
App(). The name of the list element will appear as a button in theApp().- Defaults
A list object with default selections for the Boxplot
- Misc
A named list for additional miscellaneous information.
- Slick
A
Slick-class()object- value
A
Boxplot-class()object
Details
Objects of class Boxplot are created with Boxplot()
Use plotBoxplot() to create the boxplot from the console.
Use the Code(), Label(), Description(), Value(), Preset() functions to
access and assign the values for an existing Boxplot object, see Examples
Multi-Language Support
Text with multi-language supported can be provided as a named list. Available languages:
en: English (default)es: Spanishfr: Frenchpt: Portuguese
Note
Character strings in Code, Label, and Description must all be same length
as the number of performance indicators (nPIs) in `Value
Defaults
Defaults is used to select the plot options that are selected in the Boxplot.
It is a list of length 2, with the following requirements for the list elements:
A character string. Options: 'overall' (default) or 'byom'
A character string. Options: 'boxplot' (default), 'violin', or 'both'
If unrecognized values are entered, the defaults will be used.
Functions
Boxplot(missing): Create an emptyBoxplotobjectBoxplot(character_list): Create a populatedBoxplotobjectBoxplot(Slick): ReturnBoxplotfrom aSlick-class()objectBoxplot(Slick) <- value: Assign aBoxplot-class()object to aSlick-class()object
Examples
# Generate dummy values
nsim <- 10
nOM <- 2
nMP <- 4
nPI <- 3
values <- array(NA, dim=c(nsim, nOM, nMP, nPI))
pi_means <- runif(nPI, 5, 50)
for (om in 1:nOM) {
for (mp in 1:nMP) {
for (pi in 1:nPI) {
values[,om, mp, pi] <- rlnorm(nsim, log(pi_means[pi]), 0.4)
}
}
}
# Create and populate Object
boxplot <- Boxplot(Code=c('PI1', 'PI2', 'PI3'),
Label=c('Performance Indicator 1',
'Performance Indicator 2',
'Performance Indicator 3'),
Description = c('This is the description for PI 1',
'This is the description for PI 2',
'This is the description for PI 3'),
Value=values)
# Check
Check(boxplot)
#>
#> ── Checking: "Boxplot" ──
#>
#> ✔ Complete
# Add to `Slick` object
slick <- Slick()
Boxplot(slick) <- boxplot
# Plots
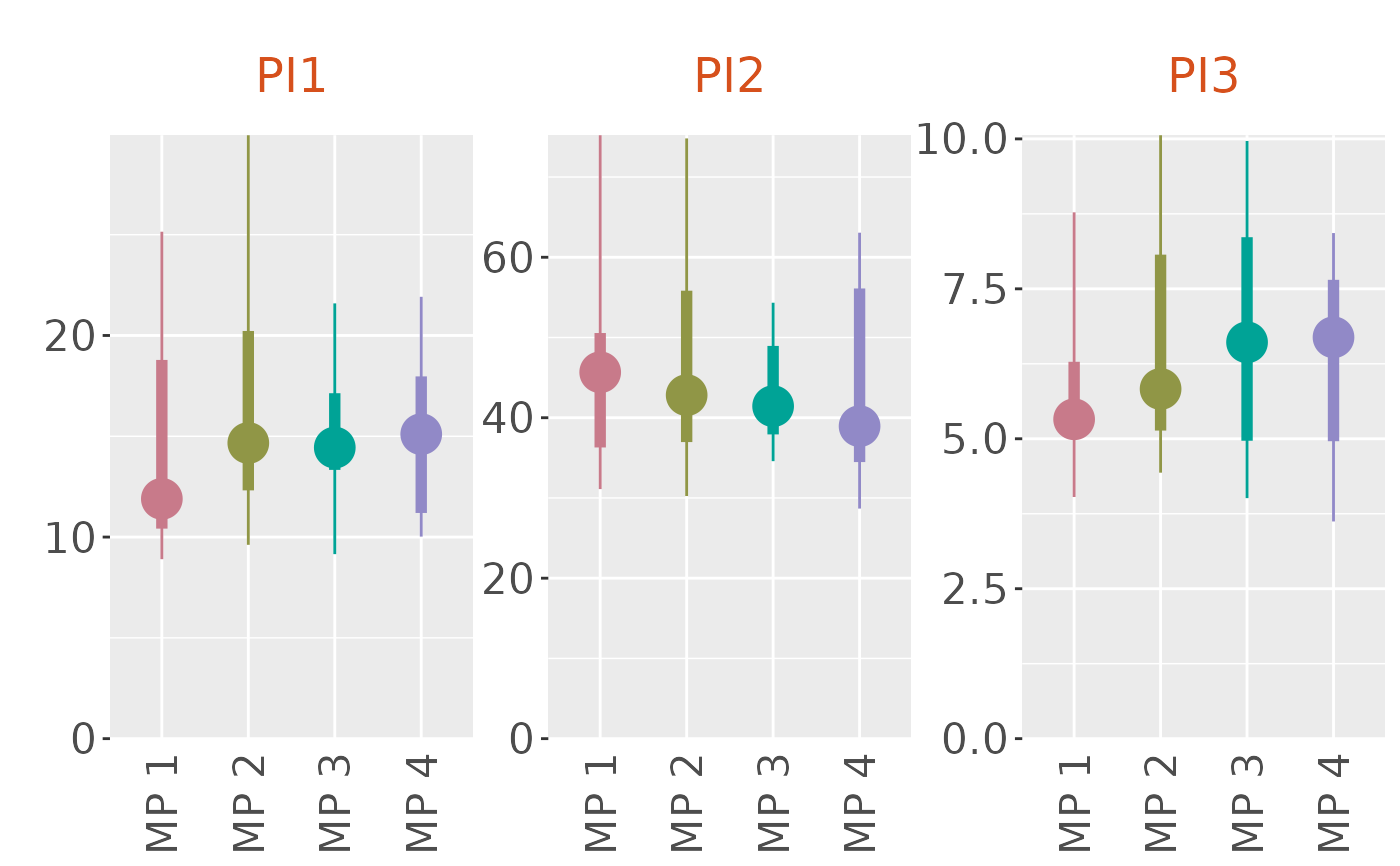
plotBoxplot(slick)
#> ℹ Note: `MPs` is empty. Using default MP names and colors
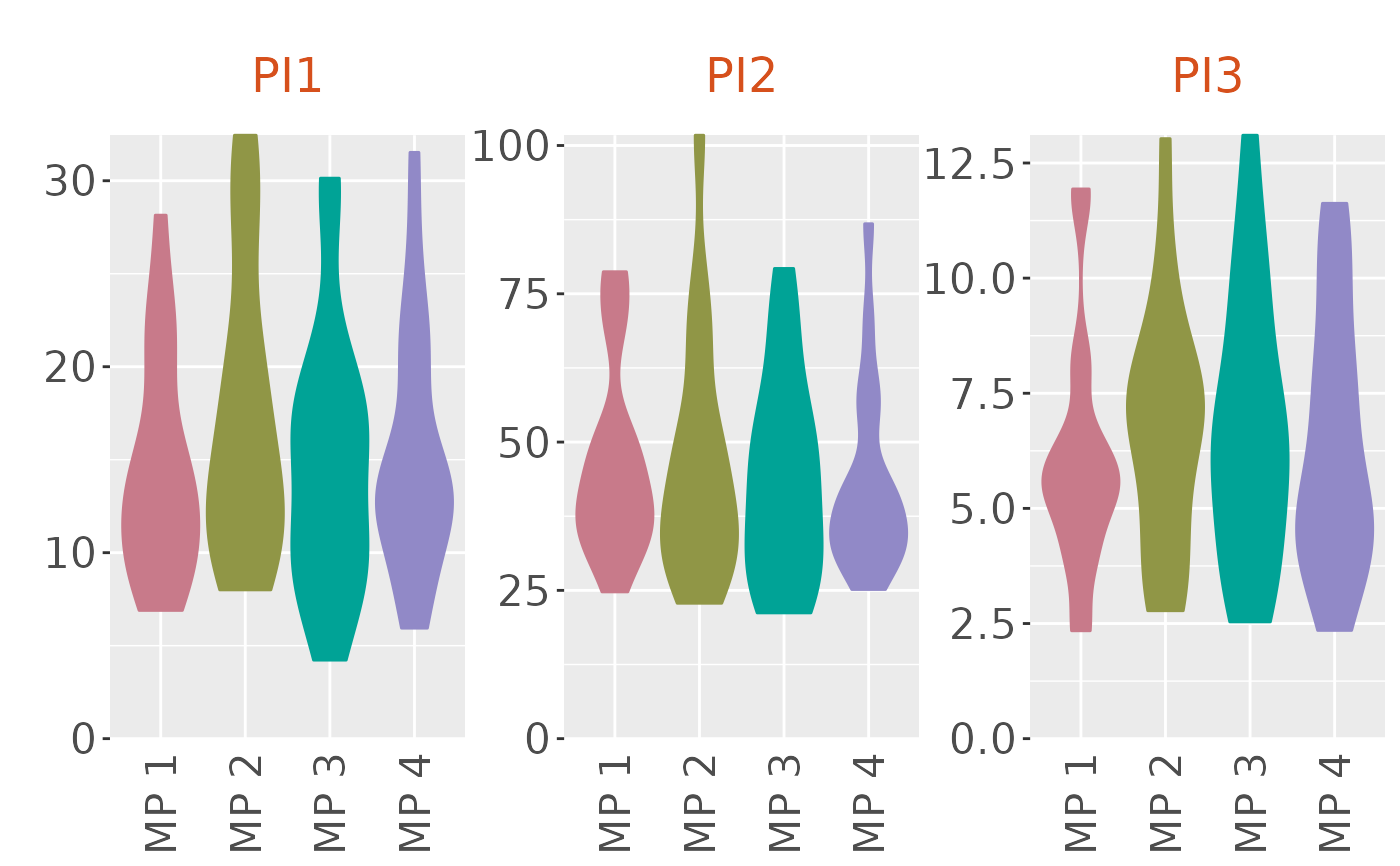
 plotBoxplot(slick, type='violin')
#> ℹ Note: `MPs` is empty. Using default MP names and colors
plotBoxplot(slick, type='violin')
#> ℹ Note: `MPs` is empty. Using default MP names and colors
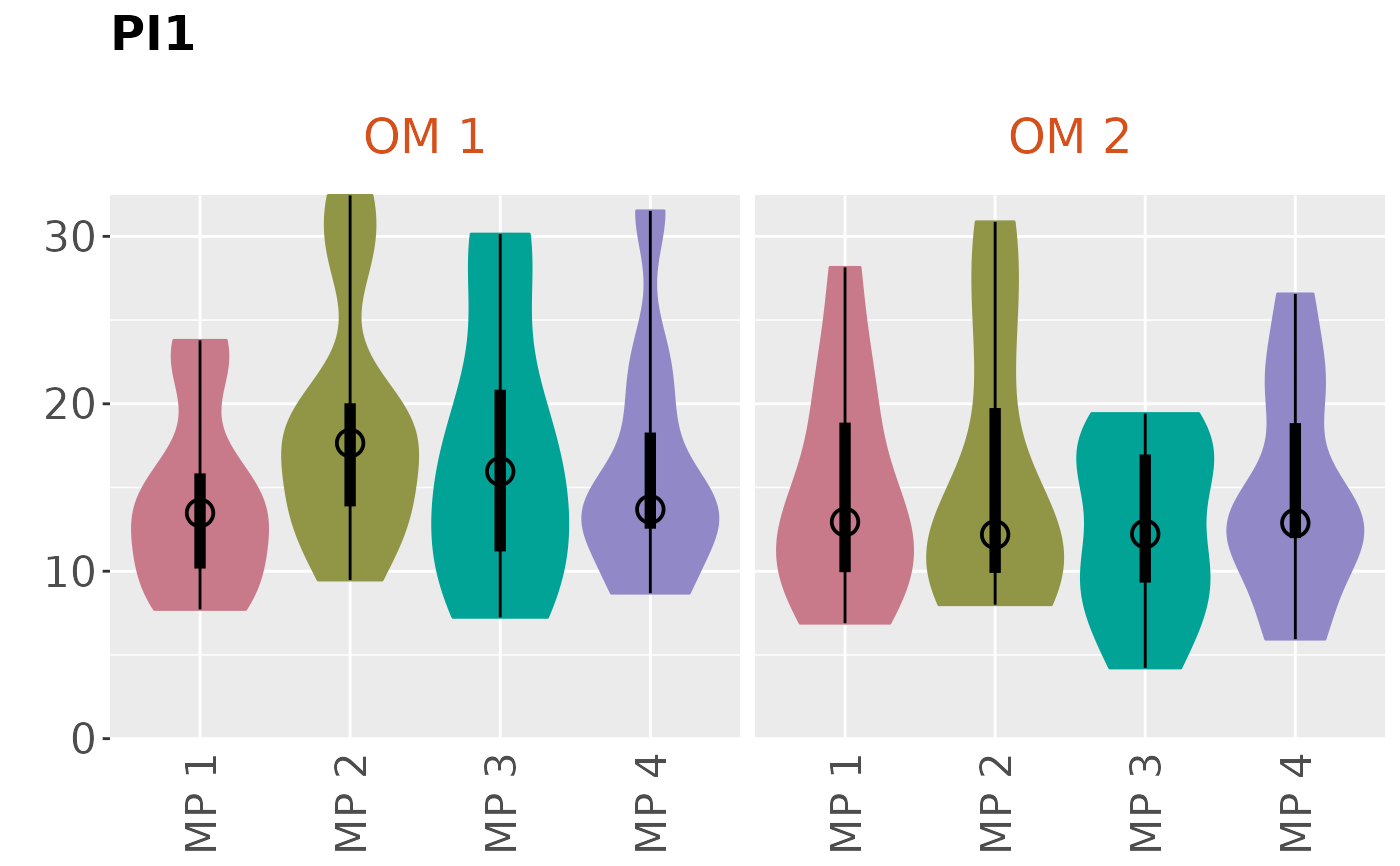
 plotBoxplot(slick, byOM=TRUE)
#> ℹ Note: `MPs` is empty. Using default MP names and colors
plotBoxplot(slick, byOM=TRUE)
#> ℹ Note: `MPs` is empty. Using default MP names and colors
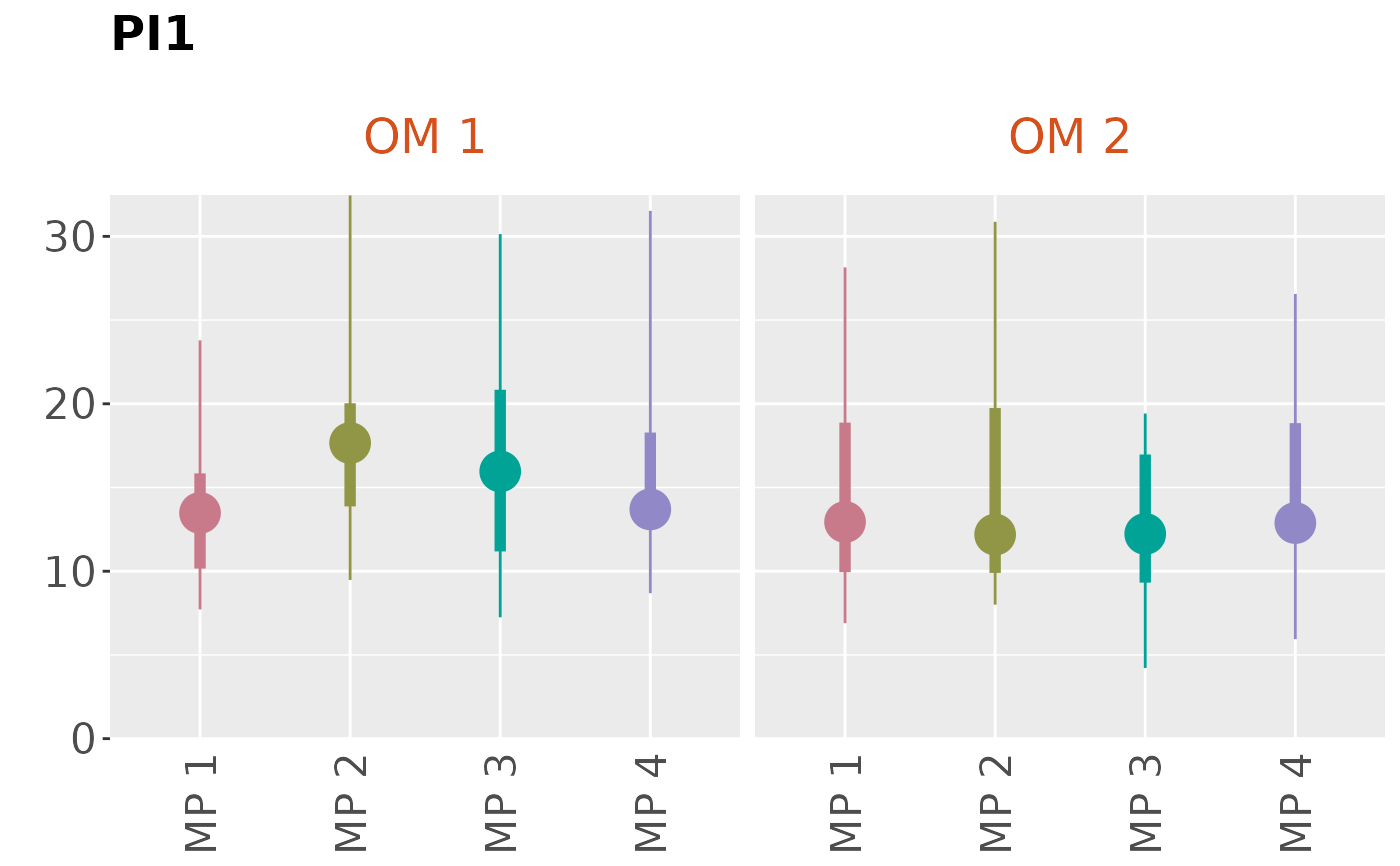 plotBoxplot(slick, 2, type='both', byOM=TRUE)
#> ℹ Note: `MPs` is empty. Using default MP names and colors
plotBoxplot(slick, 2, type='both', byOM=TRUE)
#> ℹ Note: `MPs` is empty. Using default MP names and colors