Objects of class Timeseries are used to store information for the Time Series plots.
Like all S4 objects in Slick, slots in this object can be accessed and
assigned using functions corresponding to slot name. See Timeseries() and the
the See Also section below.
Details
Objects of class Timeseries are created with Timeseries()
Slots
CodeA short code for the Performance Indicators for this object. A character string length
nPIor a named list for multi-language support. SeeDetailsLabelA short label for the Performance Indicators for this object. Used to label axes on charts. Can be longer than
Codebut recommended to keep short as possible so it shows clearly in plots and tables. A character string lengthnPIor a named list for multi-language support. SeeDetailsDescriptionA description for the Performance Indicators for this object. Can include Markdown, see
Examples. A character string lengthnPIor a named list for multi-language support. SeeDetailsTimeA numeric vector with values for the historical and projection time-steps. Must match length
nTSinValue. Can also be classDate,POSIXctorPOSIXtTimeNowA numeric value matching the last historical timestep in
TimeTimeLabCharacter string length 1. Name of the time step (e.g., 'Year'). Will be used as the label in the plots. Use a named list for multiple languages.
ValueA numeric array with the stochastic performance indicator values for each simulation (sim), operating model (OM), management procedure (MP), performance indicator (PI), and historical + projection timestep (nTS). Dimensions: c(
nsim,nOM,nMP,nPI,nTS)PresetAn optional named list for the preset buttons in the
App(). The name of the list element will appear as a button in theApp().TargetNumeric vector length
nPIwith the target value for the PIs.LimitNumeric vector length
nPIwith the limit value for the PIs.RefPointsList for setting custom Reference Points. Overrides
TargetandLimit. SeeDetailssection inTimeseries().MiscA named list for additional miscellaneous information.
Examples
# Generate dummy values
nsim <- 10
nOM <- 2
nMP <- 4
nPI <- 3
nHistTS <- 50
nProjTS <- 30
nTS <- nHistTS + nProjTS
set.seed(101)
values <- array(NA, dim=c(nsim, nOM, nMP, nPI, nTS))
pi_means <- c(1,1, 1000)
for (om in 1:nOM) {
for (pi in 1:nPI) {
# PI identical for historical
histVals <- matrix(
pi_means[pi] *
cumprod(c(rlnorm(nHistTS*nsim, 0, 0.05))),
nrow=nsim, ncol=nHistTS, byrow=TRUE)
histVals <- replicate(nMP, histVals)
values[,om, , pi,1:nHistTS] <- aperm(histVals, c(1,3,2))
for (mp in 1:nMP) {
values[,om, mp, pi,(nHistTS+1):nTS] <- matrix(
pi_means[pi] *
cumprod(c(rlnorm(nProjTS*nsim, 0, 0.05))),
nrow=nsim, ncol=nProjTS, byrow=FALSE)
}
}
}
# Create and populate Object
timeseries <- Timeseries(Code=c('B/BMSY', 'F/FMSY', 'TAC'),
Label=c('B/BMSY',
'F/FMSY',
'TAC'),
Description = c('This is the description for PI 1',
'This is the description for PI 2',
'This is the description for PI 3'),
Value=values
)
# Last historical time step
TimeNow(timeseries) <- 2024
# Add values for time steps
Time(timeseries) <- c(rev(seq(TimeNow(timeseries), by=-1, length.out=nHistTS)),
seq(TimeNow(timeseries)+1, by=1, length.out=nProjTS))
# Check
Check(timeseries)
#>
#> ── Checking: "Timeseries" ──
#>
#> ✔ Complete
# Add to `Slick` object
slick <- Slick()
Timeseries(slick) <- timeseries
# Plots
plotTimeseries(slick)
#> ℹ Note: `MPs` is empty. Using default MP names and colors
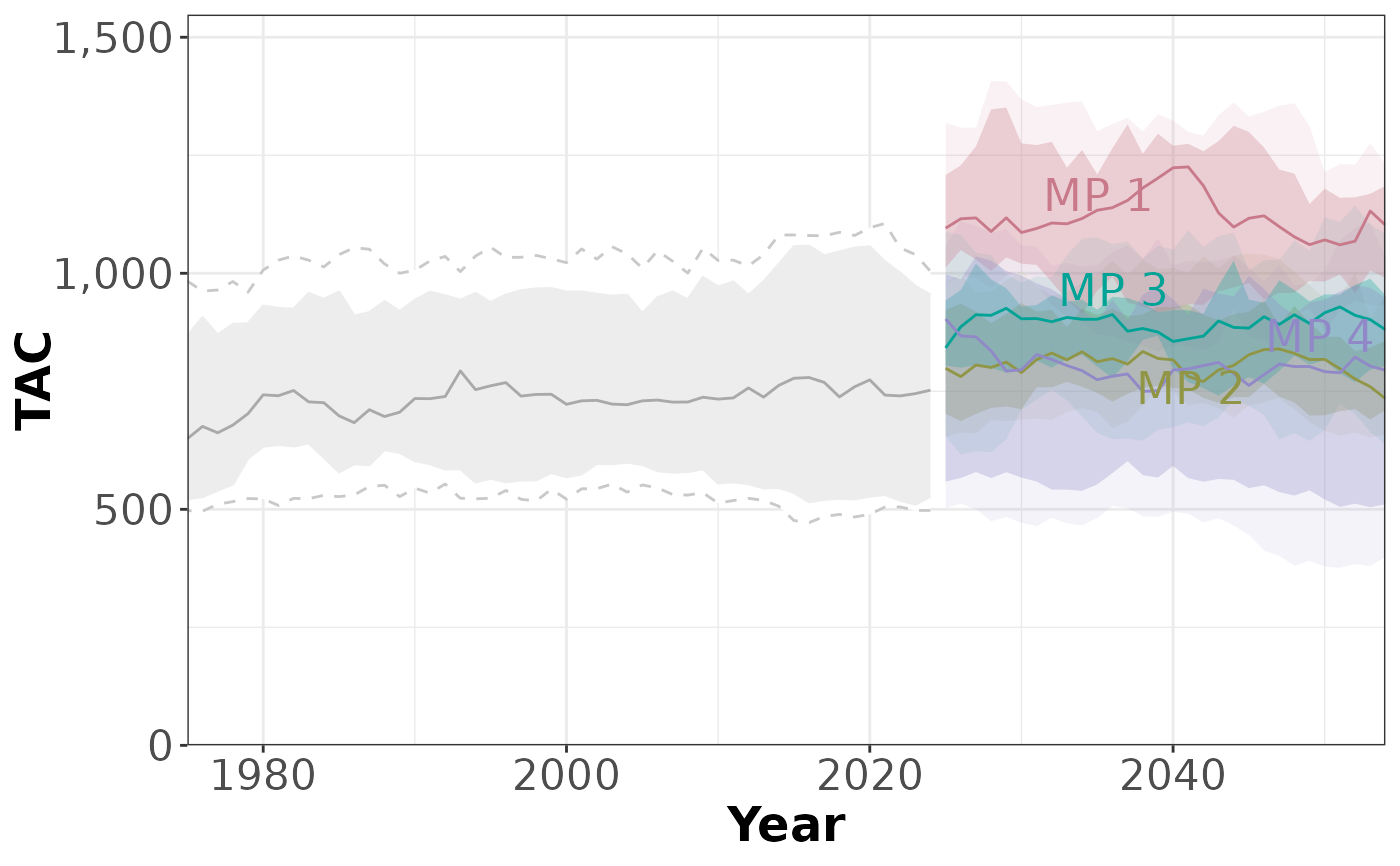 plotTimeseries(slick, 2)
#> ℹ Note: `MPs` is empty. Using default MP names and colors
plotTimeseries(slick, 2)
#> ℹ Note: `MPs` is empty. Using default MP names and colors
 plotTimeseries(slick, 3)
#> ℹ Note: `MPs` is empty. Using default MP names and colors
plotTimeseries(slick, 3)
#> ℹ Note: `MPs` is empty. Using default MP names and colors
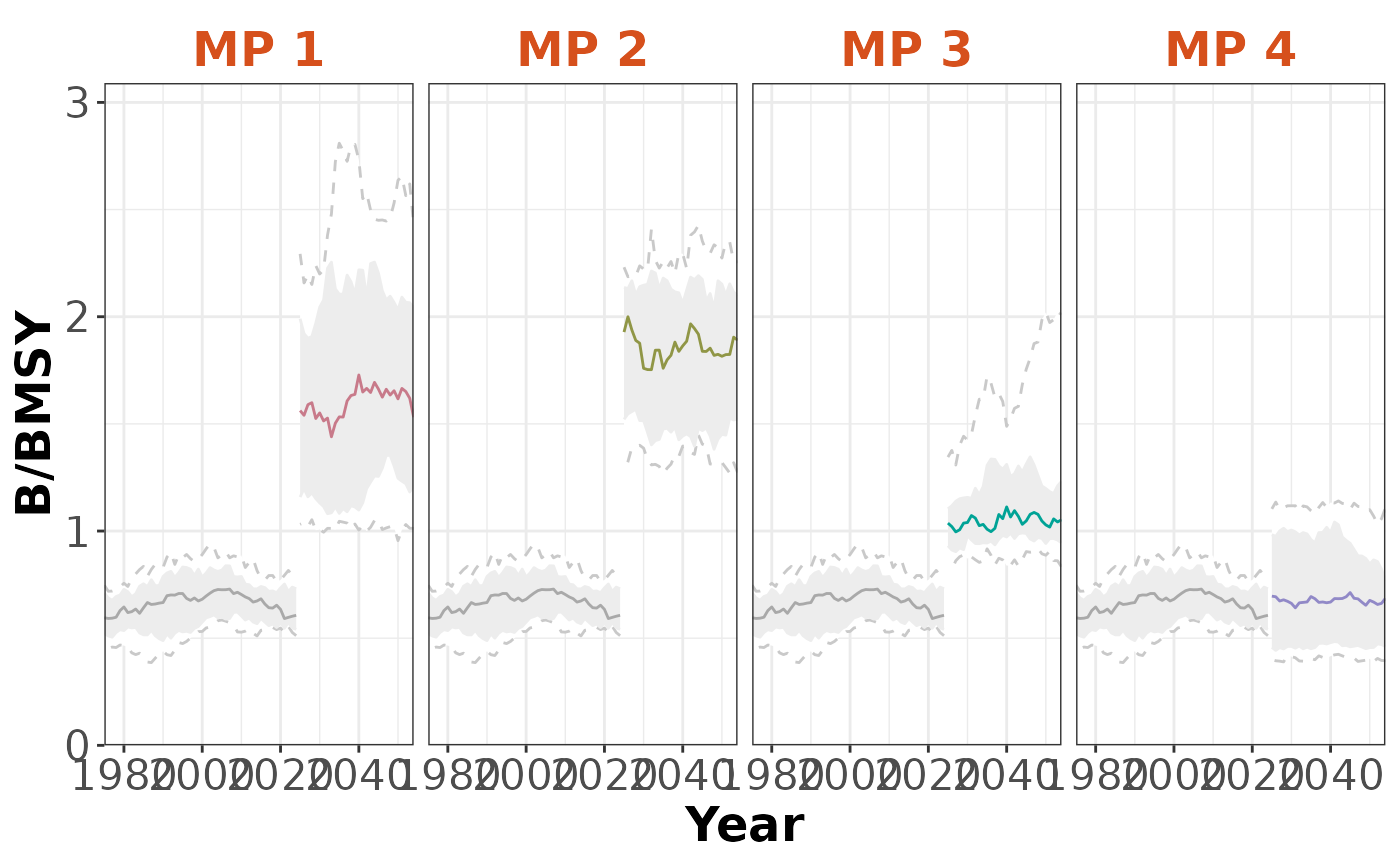
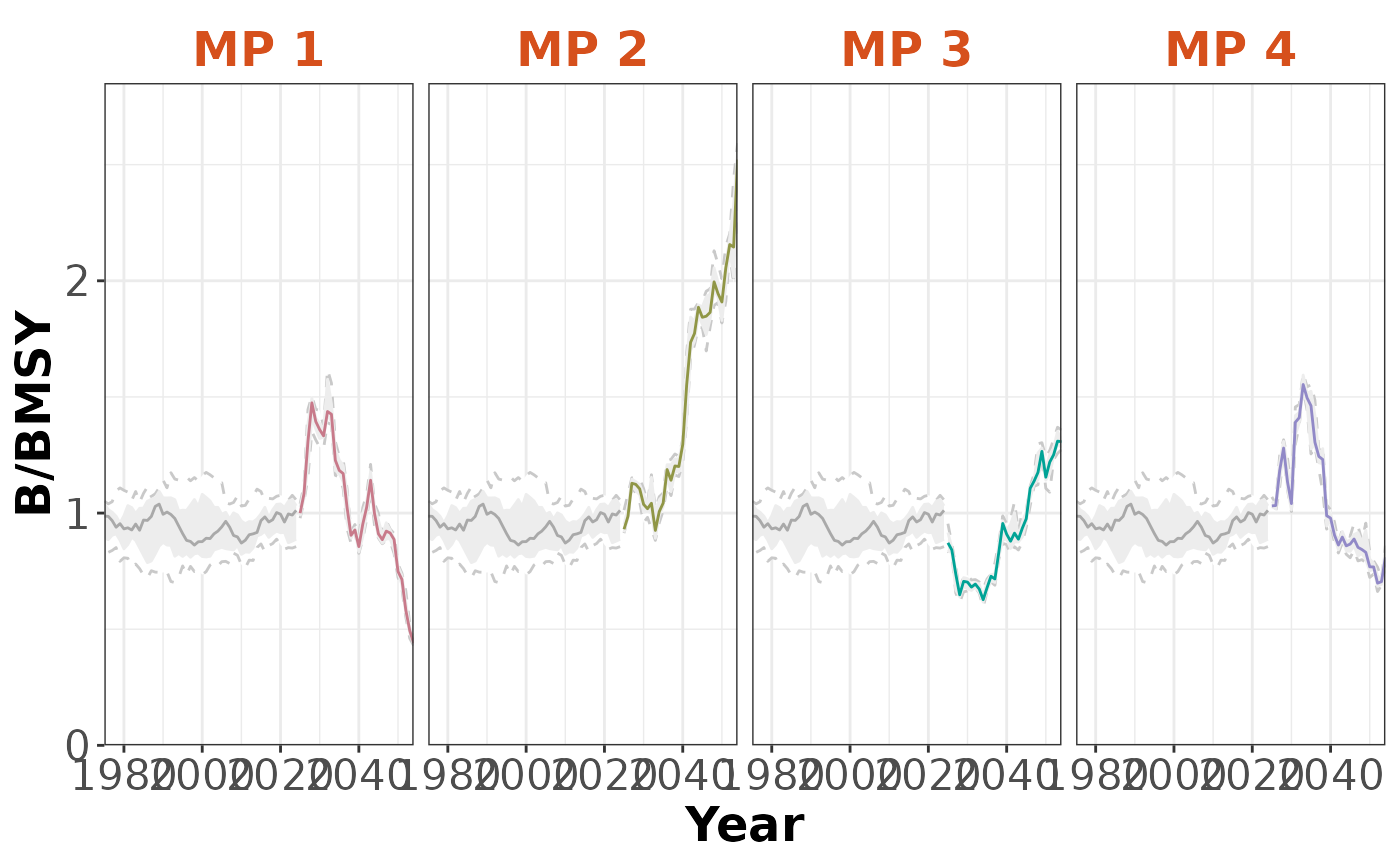
 plotTimeseries(slick, byMP=TRUE)
#> ℹ Note: `MPs` is empty. Using default MP names and colors
plotTimeseries(slick, byMP=TRUE)
#> ℹ Note: `MPs` is empty. Using default MP names and colors
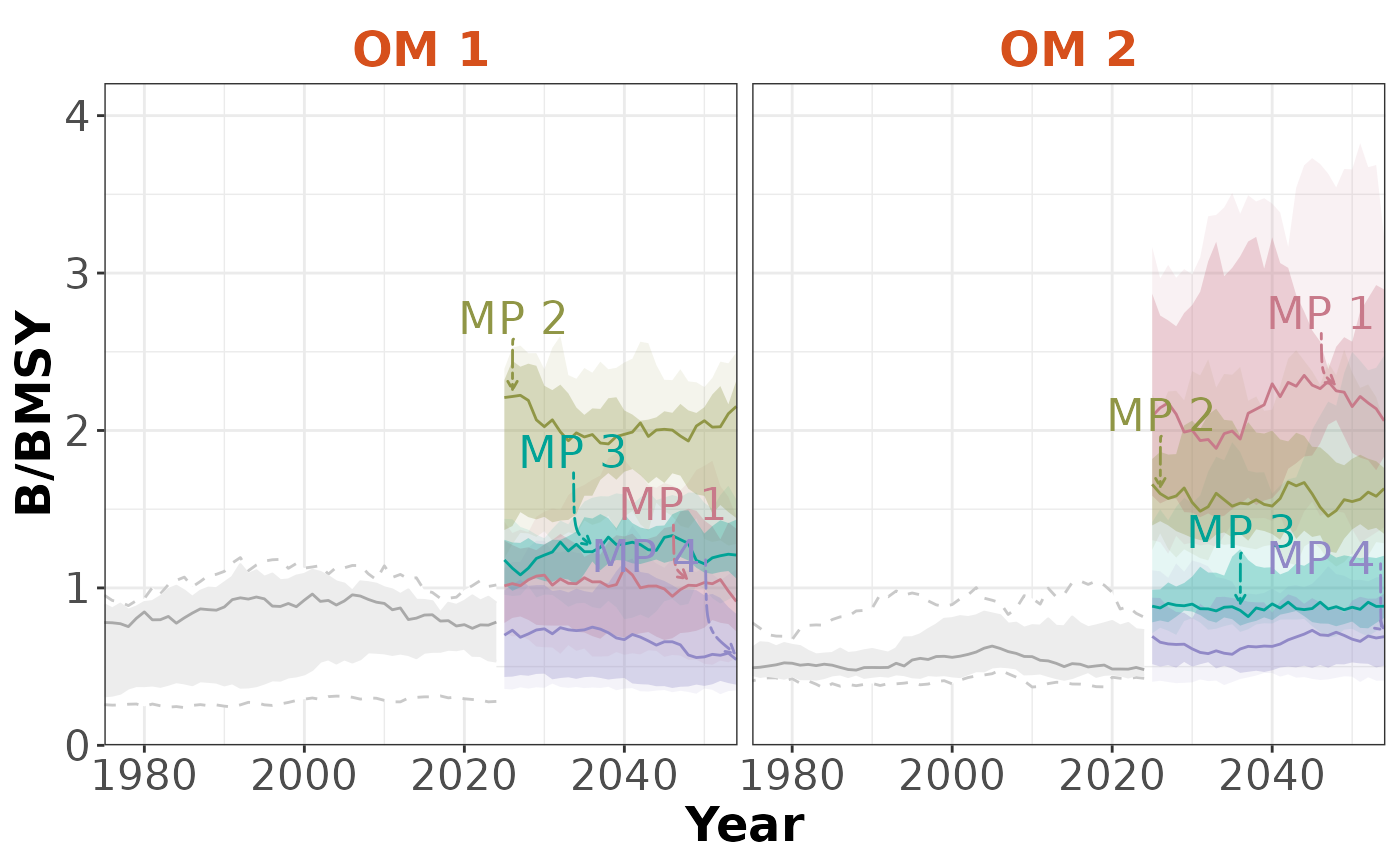
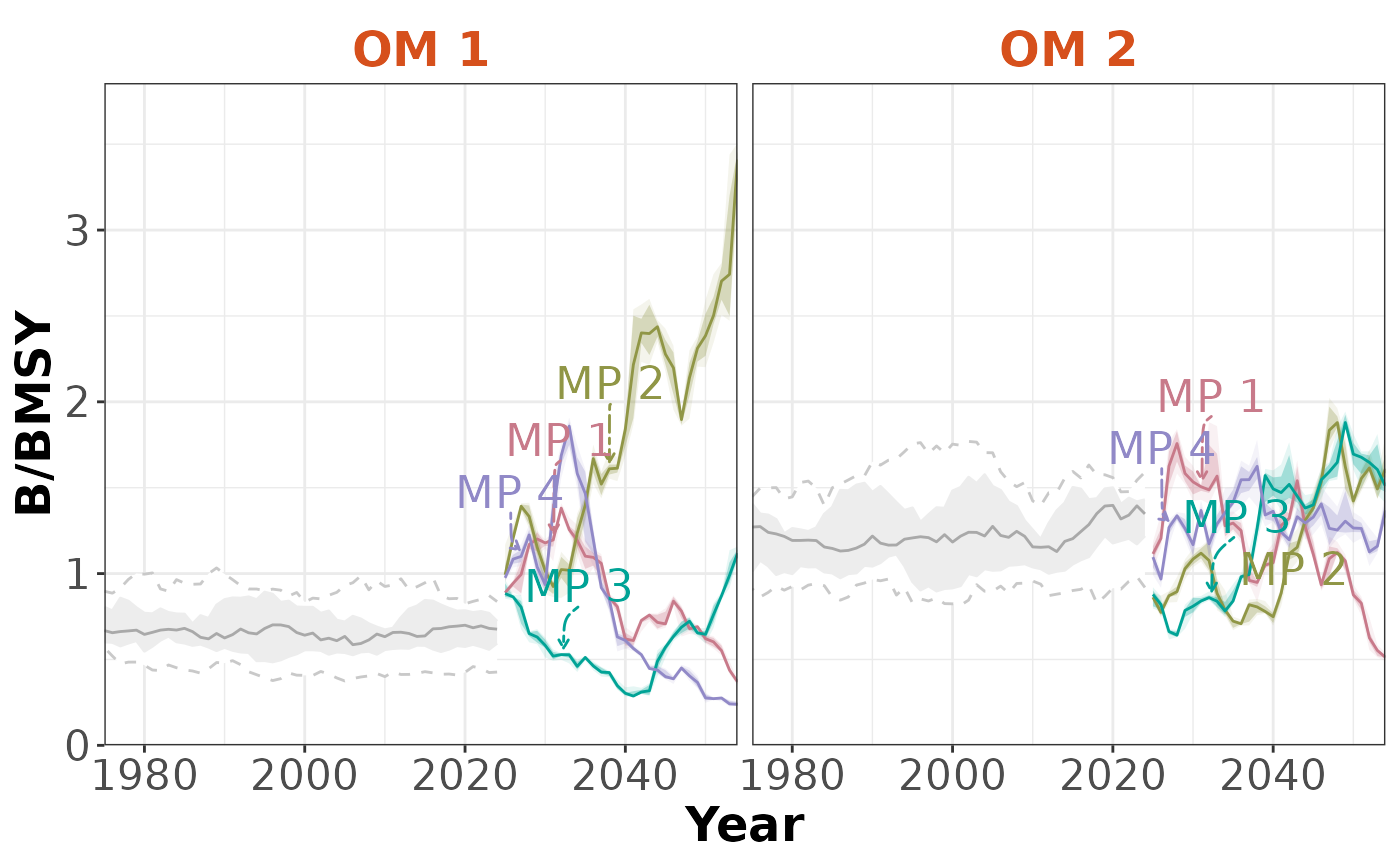
 plotTimeseries(slick, byOM=TRUE)
#> ℹ Note: `MPs` is empty. Using default MP names and colors
plotTimeseries(slick, byOM=TRUE)
#> ℹ Note: `MPs` is empty. Using default MP names and colors
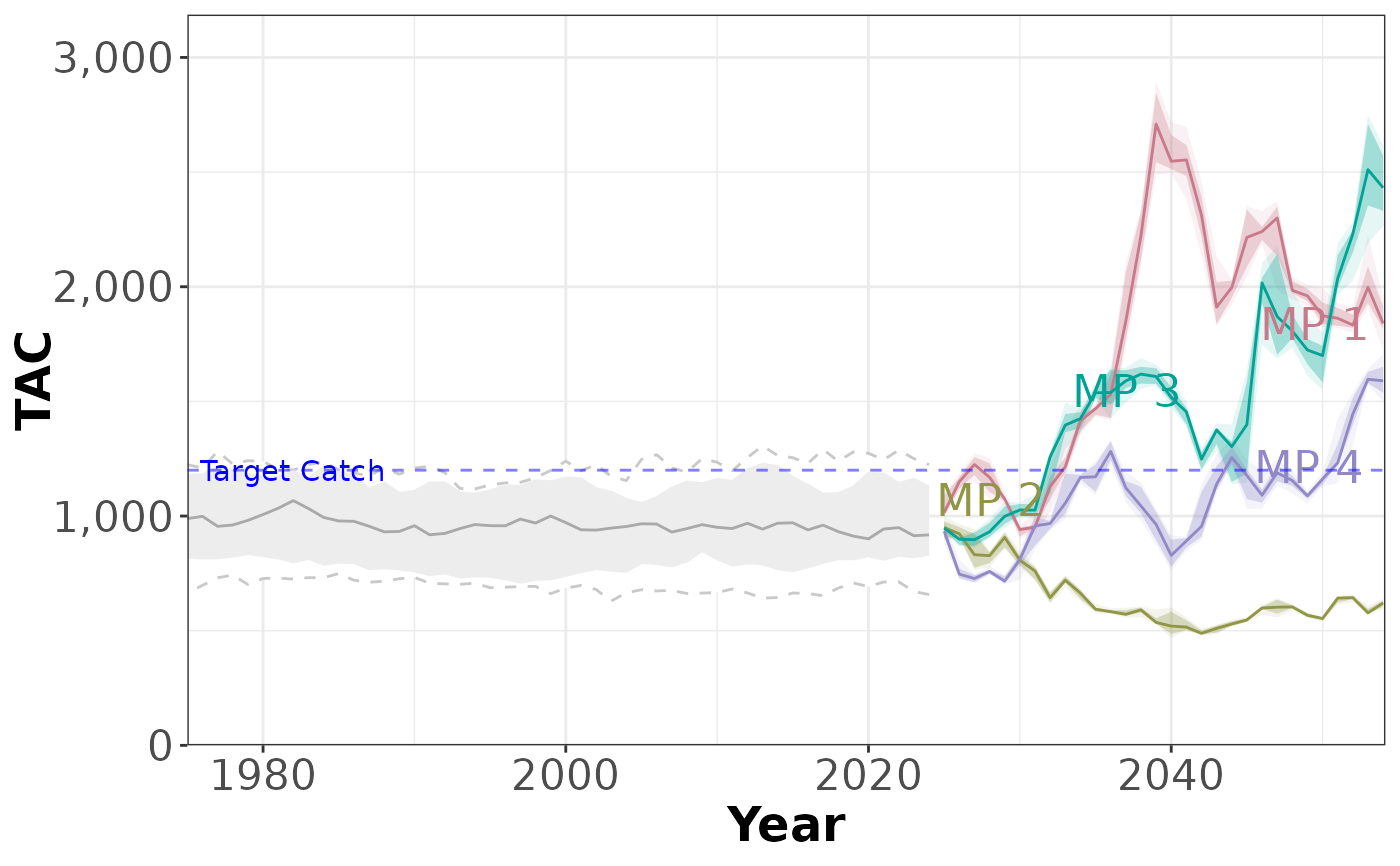
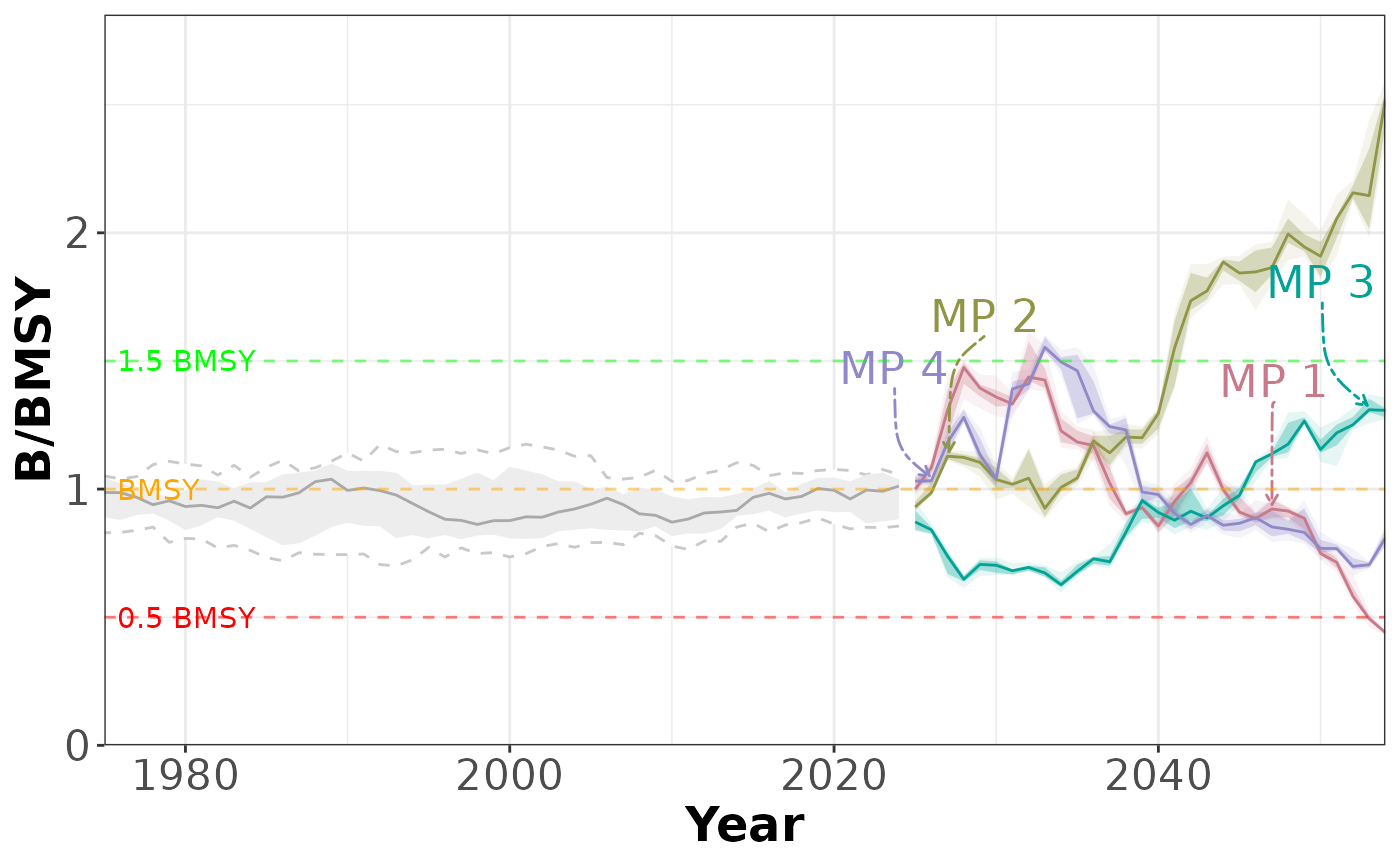
 # Custom Reference Points
RefPoints(timeseries) <- list(
list(Name=c('0.5 BMSY', 'BMSY', '1.5 BMSY'),
Value=c(0.5, 1, 1.5),
Color=c('red', 'orange', 'green')),
list(Name=c('0.8 FMSY', 'FMSY'),
Value=c(0.8,1),
Color=c('orange', 'red')),
list(Name='Target Catch',
Value=1200,
Color='blue')
)
Timeseries(slick) <- timeseries
plotTimeseries(slick)
#> ℹ Note: `MPs` is empty. Using default MP names and colors
# Custom Reference Points
RefPoints(timeseries) <- list(
list(Name=c('0.5 BMSY', 'BMSY', '1.5 BMSY'),
Value=c(0.5, 1, 1.5),
Color=c('red', 'orange', 'green')),
list(Name=c('0.8 FMSY', 'FMSY'),
Value=c(0.8,1),
Color=c('orange', 'red')),
list(Name='Target Catch',
Value=1200,
Color='blue')
)
Timeseries(slick) <- timeseries
plotTimeseries(slick)
#> ℹ Note: `MPs` is empty. Using default MP names and colors
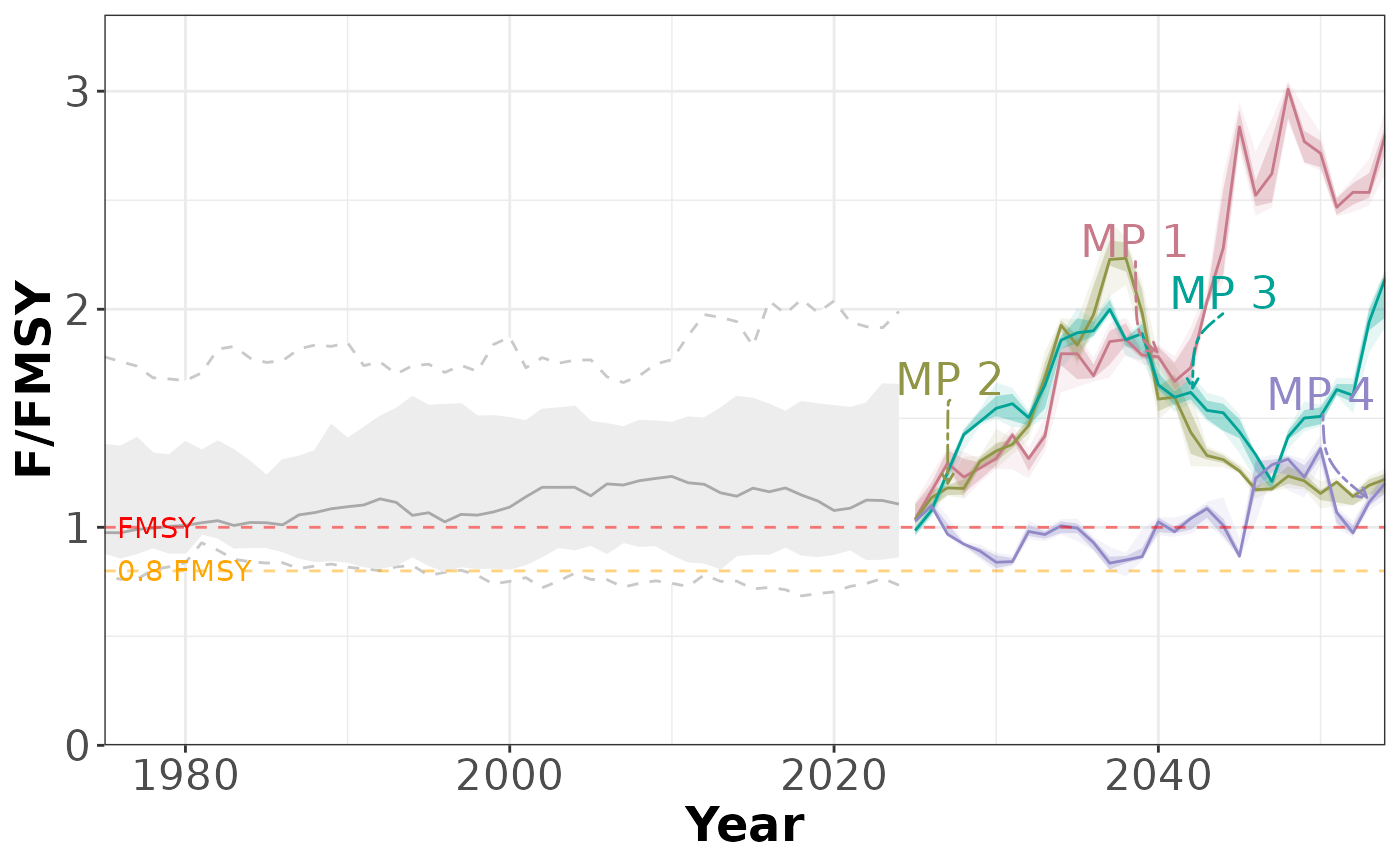
 plotTimeseries(slick, 2)
#> ℹ Note: `MPs` is empty. Using default MP names and colors
plotTimeseries(slick, 2)
#> ℹ Note: `MPs` is empty. Using default MP names and colors
 plotTimeseries(slick, 3)
#> ℹ Note: `MPs` is empty. Using default MP names and colors
plotTimeseries(slick, 3)
#> ℹ Note: `MPs` is empty. Using default MP names and colors