Methods for Creating, Accessing and Assigning Timeseries objects
Source: R/aa_generics.R, R/class_Timeseries.R, R/class_Slick.R
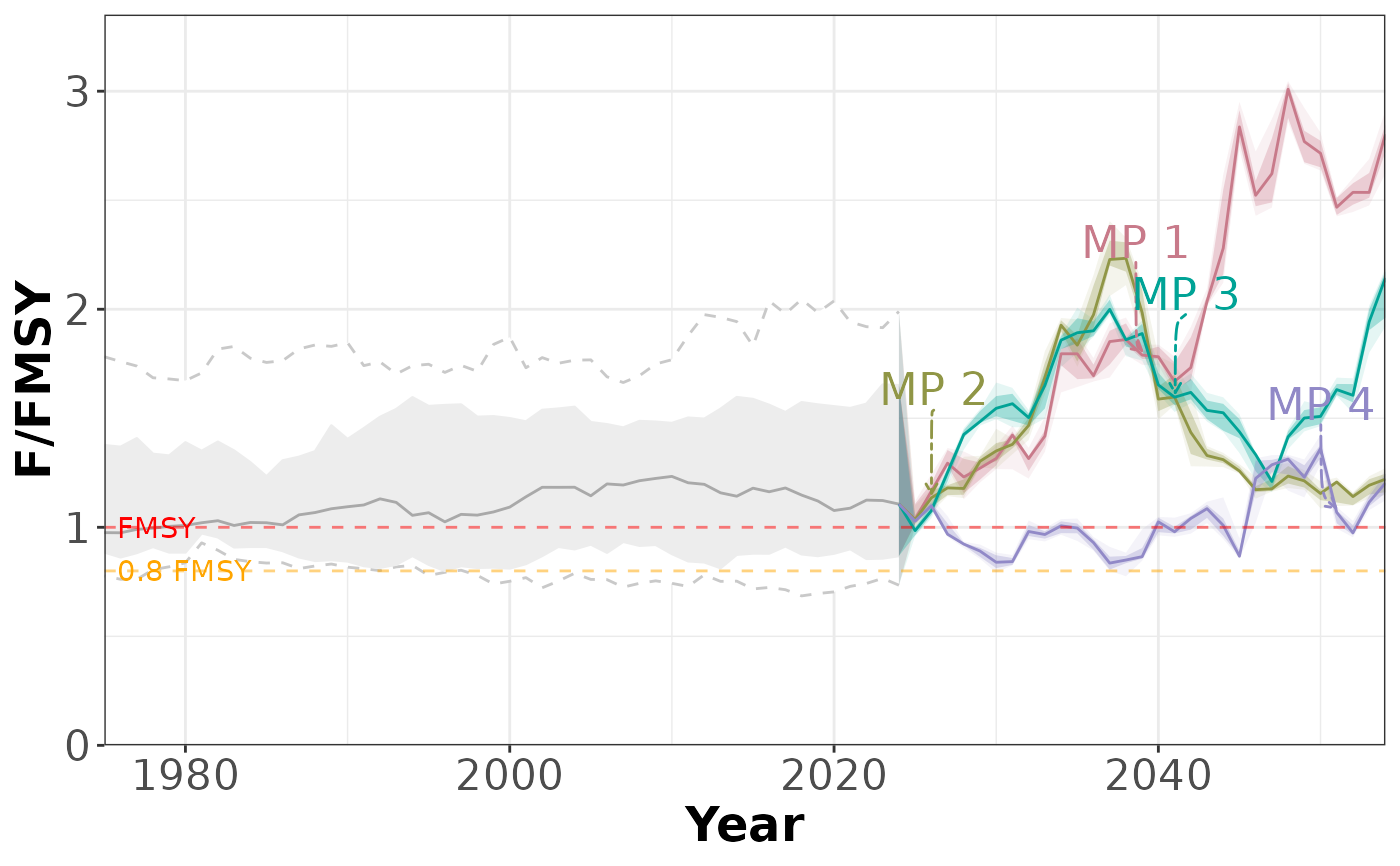
Timeseries-methods.RdAn object of class Timeseries contains information for the Time Series chart.
The Timeseries function is used both to create and modify an Timeseries-class() object,
and to access and assign Timeseries for an object of class Slick-class().
See Details.
Usage
Timeseries(
  Code = "",
  Label = "",
  Description = "",
  Time = numeric(),
  TimeNow = numeric(),
  TimeLab = "Year",
  Value = array(),
  Preset = list(),
  Target = NULL,
  Limit = NULL,
  RefPoints = list(),
  Misc = list()
)

Timeseries(Slick) <- value

# S4 method for class 'missing'
Timeseries()

# S4 method for class 'character'
Timeseries(
  Code = "",
  Label = "",
  Description = "",
  Time = numeric(),
  TimeNow = numeric(),
  TimeLab = "Year",
  Value = array(),
  Preset = list(),
  Target = NULL,
  Limit = NULL,
  RefPoints = list(),
  Misc = list()
)

# S4 method for class 'list'
Timeseries(
  Code = "",
  Label = "",
  Description = "",
  Time = numeric(),
  TimeNow = numeric(),
  TimeLab = "Year",
  Value = array(),
  Preset = list(),
  Target = NULL,
  Limit = NULL,
  RefPoints = list(),
  Misc = list()
)

# S4 method for class 'Slick'
Timeseries(Code)

# S4 method for class 'Slick'
Timeseries(Slick) <- value
Arguments
- Code
A short code for the Performance Indicators for this object. A character string length
nPIor a named list for multi-language support. SeeDetails- Label
A short label for the Performance Indicators for this object. Used to label axes on charts. Can be longer than
Codebut recommended to keep short as possible so it shows clearly in plots and tables. A character string lengthnPIor a named list for multi-language support. SeeDetails- Description
A description for the Performance Indicators for this object. Can include Markdown, see
Examples. A character string lengthnPIor a named list for multi-language support. SeeDetails- Time
A numeric vector with values for the historical and projection time-steps. Must match length
nTSinValue- TimeNow
A numeric value matching the last historical timestep in
Time- TimeLab
Character string length 1. Name of the time step (e.g., 'Year'). Will be used as the label in the
Timeseriesplot. Use a named list for multiple languages.- Value
A numeric array with the stochastic performance indicator values for each simulation (sim), operating model (OM), management procedure (MP), performance indicator (PI), and historical + projection timestep (nTS). Dimensions: c(
nsim,nOM,nMP,nPI,nTS)- Preset
An optional named list for the preset buttons in the
App(). The name of the list element will appear as a button in theApp().- Target
Numeric vector length
nPIwith the target value for the PIs.- Limit
Numeric vector length
nPIwith the limit value for the PIs.- RefPoints
List for setting custom Reference Points. Overrides
TargetandLimit. SeeDetails- Misc
A named list for additional miscellaneous information.
- Slick
A
Slick-class()object- value
A
Timeseries-class()object
Details
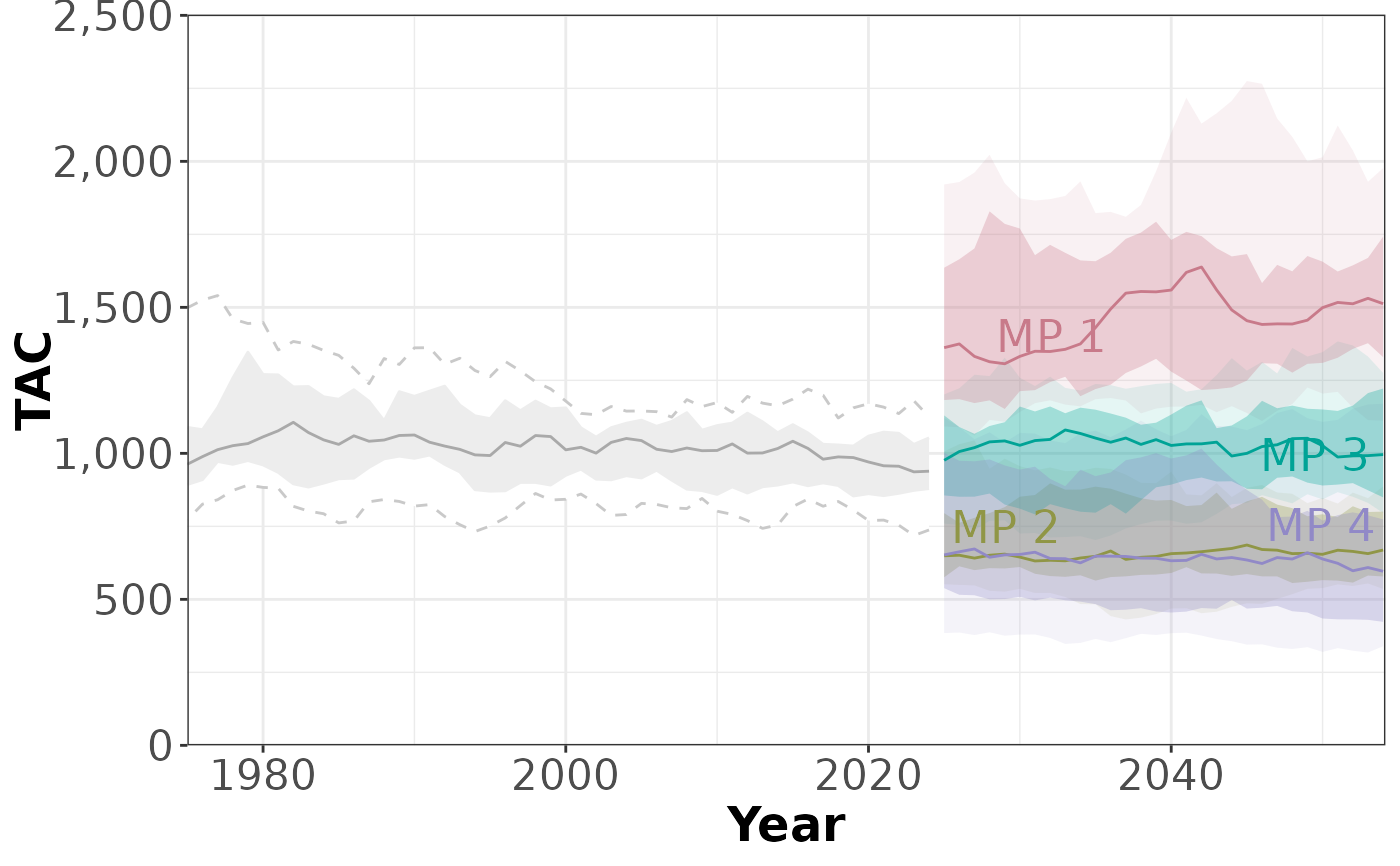
Use plotTimeseries() to create the time series plots from the console.
Note
Character strings in Code, Label, and Description must all be same length
as the number of performance indicators (nPIs) in Value
Objects of class Timeseries are created with Timeseries()
Multi-Language Support
Text with multi-language supported can be provided as a named list. Available languages:
en: English (default)es: Spanishfr: Frenchpt: Portuguese
Custom Reference Points with RefPoints
RefPoints provides more options than the default Target and Limit reference points. It can be used to control the name and
color of the reference point lines, or to add additional reference point lines to the Timeseries plot.
Note: If RefPoints is included, Target and Limit are ignored.
RefPoints must be a list of length <= length(Code) (i.e., the number of performance indicators).
Each element in RefPoints should be a named list:
Namecharacter vector with name(s) of reference point(s)Valuenumeric vector lengthNamewith value(s) for the reference point(s)Colorcharacter vector lengthNamewith color(s) for the reference point(s)
Summary Statistic
The default behaviour for the Time Series plot (see plotTimeseries()) is to show the mean value (over operating
models and simulations). If the distribution is skewed, the mean value can sometimes be misleading,
falling close to or outside of the percentiles shown in the plot. In such cases, it may be preferable
to show the median value instead.
The Time Series page in the Slick App provides users with an option to show the median value. To show the median
value by default, add a named element to the Misc slot:
Accessing Slots
Use the Code(), Label(), Description(), Value(), Preset() functions to access and assign the values for an
existing Timeseries object, see Examples
Functions
Timeseries(missing): Create an emptyTimeseriesobjectTimeseries(character): Create a populatedTimeseriesobjectTimeseries(list): Create a populatedTimeseriesobjectTimeseries(Slick): ReturnTimeseriesfrom aSlick-class()objectTimeseries(Slick) <- value: Assign aTimeseries-class()object to aSlick-class()object
Examples
# Generate dummy values
nsim <- 10
nOM <- 2
nMP <- 4
nPI <- 3
nHistTS <- 50
nProjTS <- 30
nTS <- nHistTS + nProjTS
set.seed(101)
values <- array(NA, dim=c(nsim, nOM, nMP, nPI, nTS))
pi_means <- c(1,1, 1000)
for (om in 1:nOM) {
for (pi in 1:nPI) {
# PI identical for historical
histVals <- matrix(
pi_means[pi] *
cumprod(c(rlnorm(nHistTS*nsim, 0, 0.05))),
nrow=nsim, ncol=nHistTS, byrow=TRUE)
histVals <- replicate(nMP, histVals)
values[,om, , pi,1:nHistTS] <- aperm(histVals, c(1,3,2))
for (mp in 1:nMP) {
values[,om, mp, pi,(nHistTS+1):nTS] <- matrix(
pi_means[pi] *
cumprod(c(rlnorm(nProjTS*nsim, 0, 0.05))),
nrow=nsim, ncol=nProjTS, byrow=FALSE)
}
}
}
# Create and populate Object
timeseries <- Timeseries(Code=c('B/BMSY', 'F/FMSY', 'TAC'),
Label=c('B/BMSY',
'F/FMSY',
'TAC'),
Description = c('This is the description for PI 1',
'This is the description for PI 2',
'This is the description for PI 3'),
Value=values
)
# Last historical time step
TimeNow(timeseries) <- 2024
# Add values for time steps
Time(timeseries) <- c(rev(seq(TimeNow(timeseries), by=-1, length.out=nHistTS)),
seq(TimeNow(timeseries)+1, by=1, length.out=nProjTS))
# Check
Check(timeseries)
#>
#> ── Checking: "Timeseries" ──
#>
#> ✔ Complete
# Add to `Slick` object
slick <- Slick()
Timeseries(slick) <- timeseries
# Plots
plotTimeseries(slick)
#> ℹ Note: `MPs` is empty. Using default MP names and colors
 plotTimeseries(slick, 2)
#> ℹ Note: `MPs` is empty. Using default MP names and colors
plotTimeseries(slick, 2)
#> ℹ Note: `MPs` is empty. Using default MP names and colors
 plotTimeseries(slick, 3)
#> ℹ Note: `MPs` is empty. Using default MP names and colors
plotTimeseries(slick, 3)
#> ℹ Note: `MPs` is empty. Using default MP names and colors
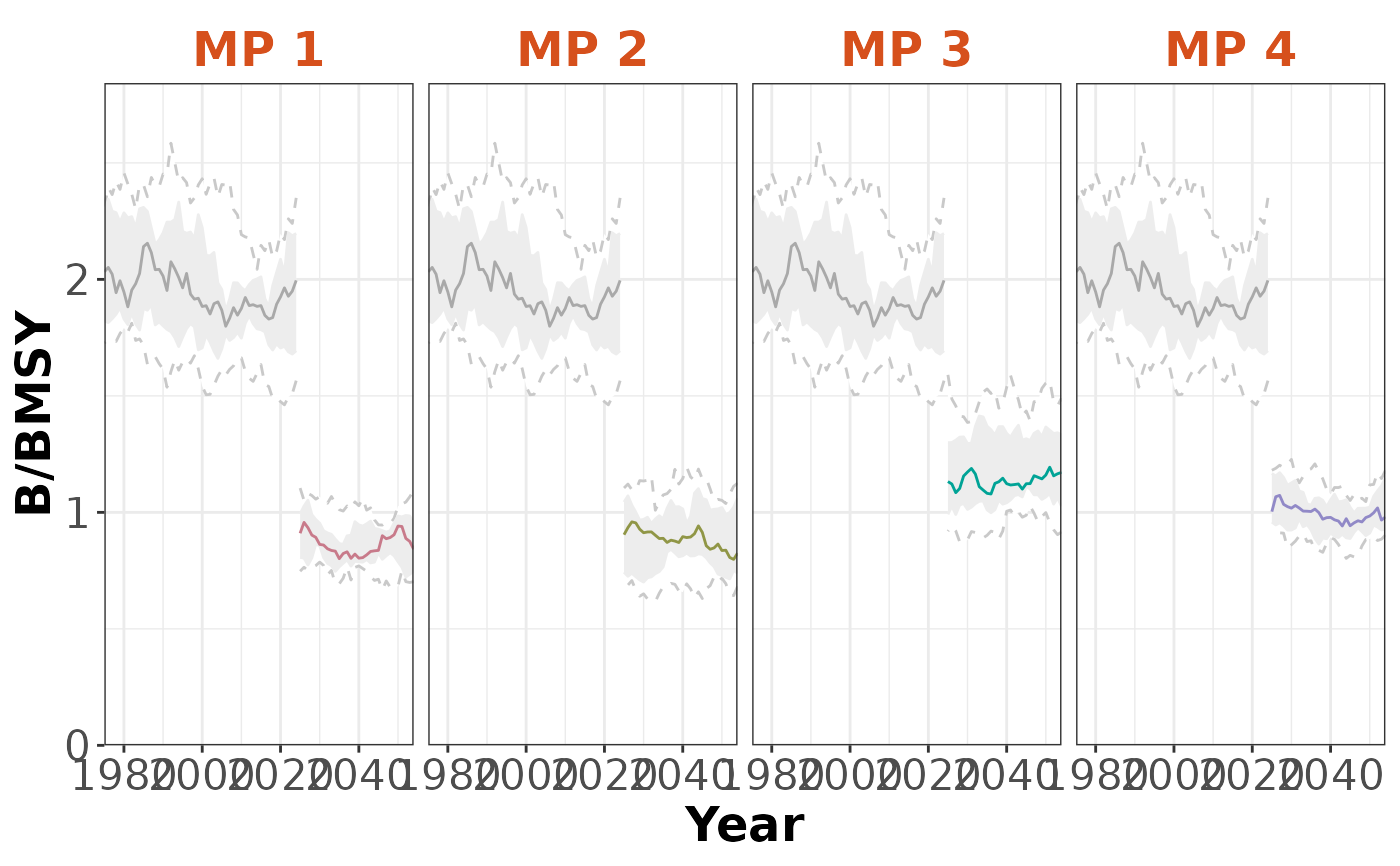
 plotTimeseries(slick, byMP=TRUE)
#> ℹ Note: `MPs` is empty. Using default MP names and colors
plotTimeseries(slick, byMP=TRUE)
#> ℹ Note: `MPs` is empty. Using default MP names and colors
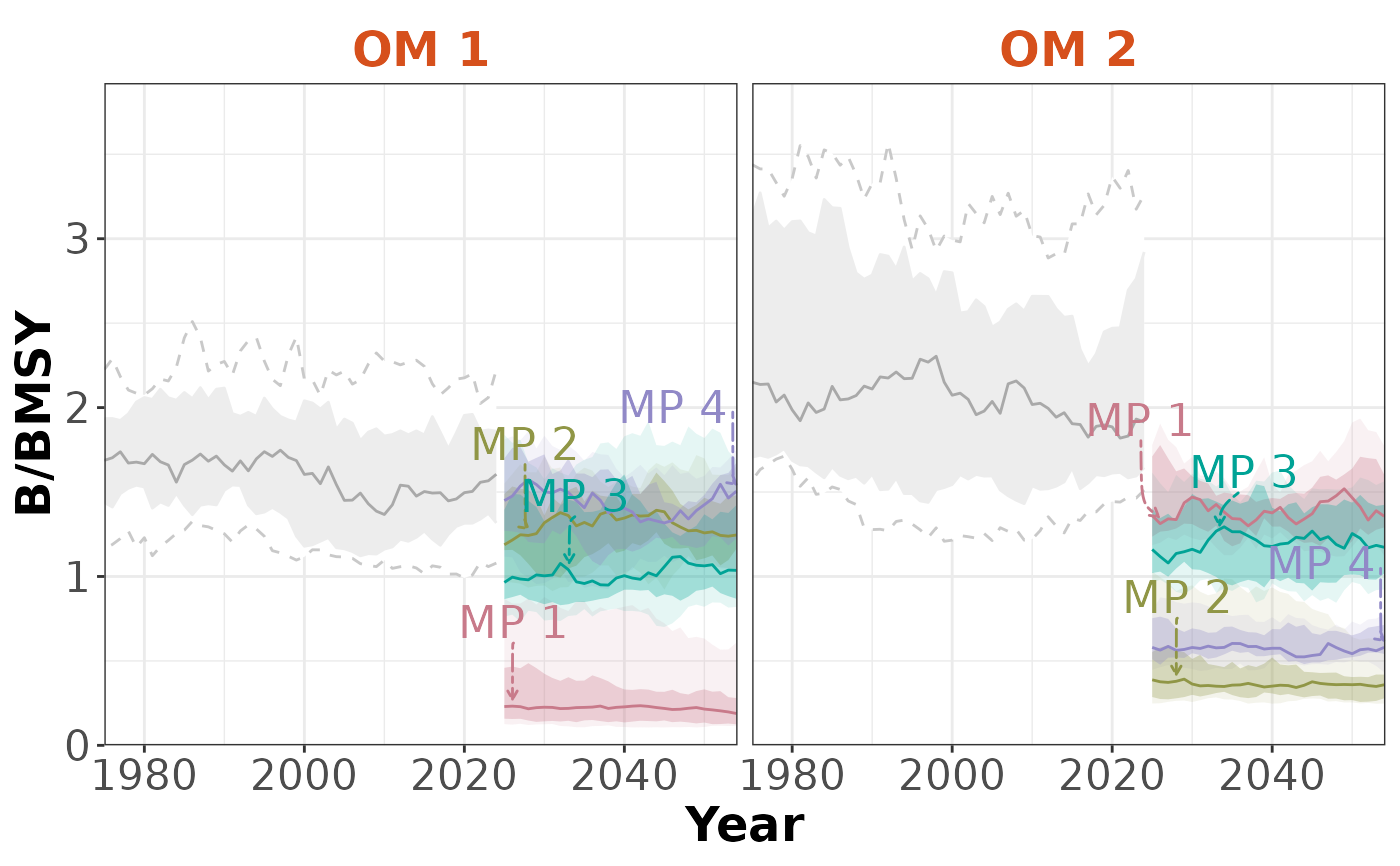
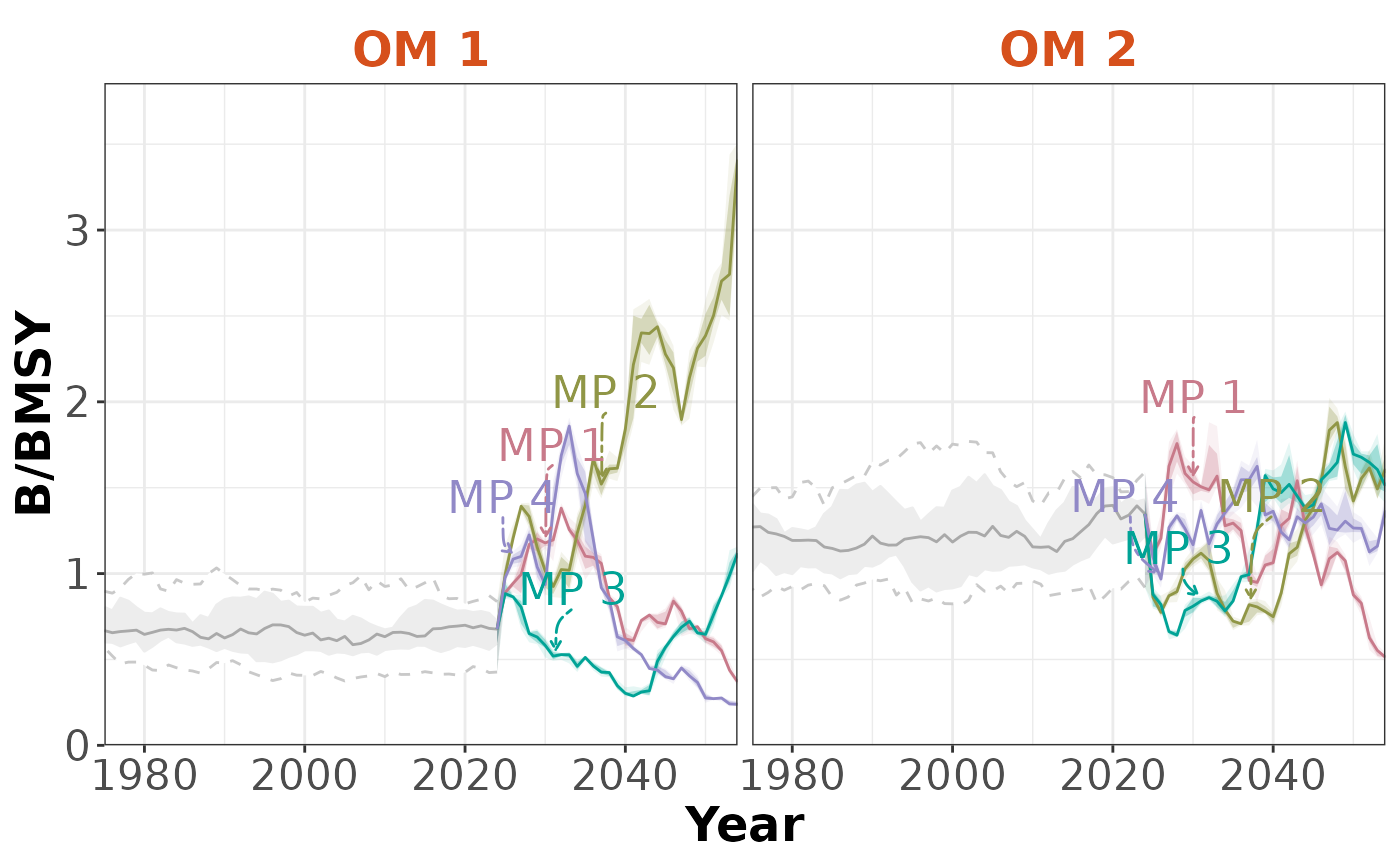
 plotTimeseries(slick, byOM=TRUE)
#> ℹ Note: `MPs` is empty. Using default MP names and colors
plotTimeseries(slick, byOM=TRUE)
#> ℹ Note: `MPs` is empty. Using default MP names and colors
 # Custom Reference Points
RefPoints(timeseries) <- list(
list(Name=c('0.5 BMSY', 'BMSY', '1.5 BMSY'),
Value=c(0.5, 1, 1.5),
Color=c('red', 'orange', 'green')),
list(Name=c('0.8 FMSY', 'FMSY'),
Value=c(0.8,1),
Color=c('orange', 'red')),
list(Name='Target Catch',
Value=1200,
Color='blue')
)
Timeseries(slick) <- timeseries
plotTimeseries(slick)
#> ℹ Note: `MPs` is empty. Using default MP names and colors
# Custom Reference Points
RefPoints(timeseries) <- list(
list(Name=c('0.5 BMSY', 'BMSY', '1.5 BMSY'),
Value=c(0.5, 1, 1.5),
Color=c('red', 'orange', 'green')),
list(Name=c('0.8 FMSY', 'FMSY'),
Value=c(0.8,1),
Color=c('orange', 'red')),
list(Name='Target Catch',
Value=1200,
Color='blue')
)
Timeseries(slick) <- timeseries
plotTimeseries(slick)
#> ℹ Note: `MPs` is empty. Using default MP names and colors
 plotTimeseries(slick, 2)
#> ℹ Note: `MPs` is empty. Using default MP names and colors
plotTimeseries(slick, 2)
#> ℹ Note: `MPs` is empty. Using default MP names and colors
 plotTimeseries(slick, 3)
#> ℹ Note: `MPs` is empty. Using default MP names and colors
plotTimeseries(slick, 3)
#> ℹ Note: `MPs` is empty. Using default MP names and colors
